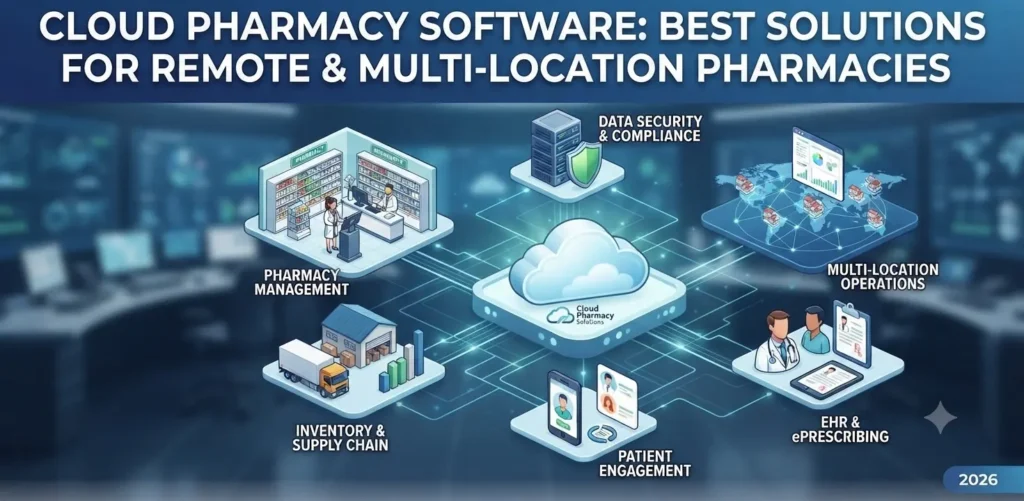
Welcome to Trident Information Systems!
Write us to - info@tridentinfo.com
Let's Socialize

Trident Information Systems

Best Pharmacy Management Software in 2026: Complete Comparison & Pricing Guide

Compare the top pharmacy management software, including Microsoft Dynamics 365, LS Central, Business Central, and industry-leading solutions. Find the perfect platform for prescription management, insurance billing, compliance, and retail operations. Your pharmacy management software isn’t just technology – it’s the operational backbone that processes every prescription, manages every insurance claim, tracks every expiry date, and handles every customer interaction. Choose the wrong system, and you’ll fight it daily: rejected claims, compliance violations, inventory errors, and frustrated staff. Choose the right one, and it becomes your competitive advantage. The pharmacy management software market in 2026 offers dozens of solutions: legacy on-premise systems (PioneerRx, Liberty, QS/1), modern cloud platforms (RxVantage, BestRx), and Microsoft-powered enterprise solutions (Dynamics 365, Business Central, LS Central) that unify pharmacy operations with back-office management, retail POS, and business intelligence. This guide focuses on helping you understand: which platforms dominate the market, why Microsoft solutions are increasingly preferred for pharmacy chains and growing businesses, what features are non-negotiable, how pricing actually works, and which system fits your specific pharmacy type and size. What Is Pharmacy Management Software? Pharmacy management software is a specialized ERP system designed to handle the unique complexities of pharmacy operations — from prescription processing and insurance billing to inventory management, regulatory compliance, and retail sales. Why Generic POS or ERP Systems Fail in Pharmacies Pharmacies have requirements that generic retail or healthcare systems simply can’t handle: Prescription Management E-prescribing, refill automation, drug interaction checking, sig code translation, and clinical decision support. Insurance Billing Real-time adjudication, NCPDP D.0 claims, rejection resolution, Medicare Part D, Medicaid, PBM integration. Regulatory Compliance HIPAA, DEA controlled substance tracking, DSCSA drug traceability, state board reporting, expiry management. Inventory Control Lot and serial tracking, automated reordering from wholesalers (Cardinal, McKesson, ABC), expiry alerts, FEFO/FIFO. Retail Operations Point of sale for OTC products, loyalty programs, omnichannel (in-store, online, mobile), customer management. Analytics & Reporting DIR fee tracking, margin analysis by drug, prescription volume trends, payor mix, inventory turnover, profitability by location. Platform vs. Best-of-Breed Approach Some pharmacies use separate systems for dispensing, POS, and back-office (best-of-breed). Others prefer unified platforms like LS Central or Dynamics 365 that handle everything in one database. Unified platforms eliminate integration headaches but may have fewer specialized features. Choose based on your IT resources and complexity tolerance. Must-Have Features Every Pharmacy Needs in 2026 Not all pharmacy management software is created equal. Here are the non-negotiable features any modern system must include: ✓ Core Features Checklist Advanced Features (Competitive Differentiators) Microsoft Solutions: Dynamics 365, Business Central & LS Central for Pharmacy Microsoft offers three pharmacy-capable platforms, each designed for different business sizes and operational complexity: LS Central for Pharmacy (Recommended for Most) Best for: Independent pharmacies, regional chains (2-50 locations), and pharmacies that also run retail stores What It Is: LS Central is a unified retail and pharmacy platform built on Microsoft Dynamics 365 Business Central. It’s specifically designed for pharmacies and includes pharmacy-specific features out-of-the-box. Pricing: $50,000-$200,000 implementation + $200-$500/user/month licensing (typically 5-15 users) Timeline: 3-6 months implementation for standard deployment Microsoft Dynamics 365 Finance & Operations (Enterprise ERP) Best for: Large pharmacy chains (50+ locations), pharmaceutical distributors, hospital pharmacy systems When to Choose D365 F&O Over LS Central: Key Capabilities: Note: Dynamics 365 F&O requires pharmacy-specific add-ons or customization for prescription processing, insurance billing, and clinical features. It’s overkill for most pharmacies unless you’re enterprise-scale. Pricing: $150,000-$500,000+ implementation + $300-$500/user/month Microsoft Dynamics 365 Business Central (SMB ERP) Best for: Small independent pharmacies that need basic accounting/inventory but use separate pharmacy-specific software for dispensing Business Central is the ERP foundation that LS Central is built on. If you use a standalone pharmacy system (like PioneerRx or Liberty) but need better financial management, Business Central can handle: Pricing: $70-$120/user/month + $10,000-$50,000 implementation Why Choose Microsoft Over Competitors? Microsoft platforms integrate seamlessly with tools your staff already uses (Excel, Outlook, Teams, OneDrive). You get enterprise-grade security, HIPAA compliance out-of-the-box, and the ability to add modules (HR, advanced analytics, customer insights) without replacing your core system. Plus, Microsoft’s cloud infrastructure (Azure) offers 99.9% uptime and disaster recovery capabilities that standalone pharmacy vendors can’t match. Top 10 Pharmacy Management Software Systems Compared Here are the leading pharmacy management platforms in 2026, ranked by market share, features, and customer satisfaction: LS Central for Pharmacy Best All-in-One Platform Custom enterprise pricing PioneerRx Best for Independent Pharmacies $650 per month (single location) Liberty Software Best for Small Chains $799 per month (single location) QS/1 Best Legacy System $599 per month (single location) Dynamics 365 F&O Best Enterprise ERP $300+ per user/month BestRx Best Cloud Platform $499 per month RxVantage Best for Compounding $899 per month Cerner PharmNet Best for Hospital Pharmacies Custom enterprise pricing ComputerRx Best Budget Option $399 per month Business Central Best Back-Office ERP $70 per user/month Feature Comparison: Microsoft vs. Competitors Here’s how LS Central and Microsoft solutions stack up against leading pharmacy systems: Feature LS Central PioneerRx Liberty D365 F&O Prescription Processing ✓ Built-in ✓ Excellent ✓ Strong ✗ Requires add-on E-Prescribing (EPCS) ✓ Surescripts ✓ Surescripts ✓ Surescripts △ Custom integration Insurance Billing (NCPDP) ✓ Native ✓ Excellent ✓ Strong △ Custom Multi-Location Management ✓ Unlimited △ Limited (5-10) ✓ Good (20+) ✓ Enterprise scale Retail POS Integration ✓ Unified platform △ Basic POS ✓ Integrated ✓ D365 Commerce Financial Management (ERP) ✓ Full ERP ✗ Basic accounting △ Limited ✓ Advanced Omnichannel (Online/Mobile) ✓ Native △ Mobile app only △ Third-party ✓ D365 Commerce Business Intelligence ✓ Power BI △ Basic reports △ Standard reports ✓ Power BI Microsoft 365 Integration ✓ Seamless ✗ None ✗ None ✓ Native Cloud Hosting (Azure) ✓ HIPAA-compliant △ Third-party △ Optional ✓ Azure native Typical Implementation 4-6 months 4-8 weeks 6-12 weeks 12-18 months Best For Growing chains (5-50 stores) Single location independents Small chains (2-10 stores) Enterprise (100+ locations) Pricing Models: What You’ll Actually Pay Pharmacy software pricing varies dramatically. Here’s the realistic breakdown: Monthly Software Licensing Implementation Costs (One-Time) Hidden Costs to Budget For Total Cost of Ownership (TCO) Examples Single Independent Pharmacy (1 location): PioneerRx: $650/month × 36 months + $10K implementation

Best Pharmacy Management Software in 2026: Complete Comparison & Pricing Guide Read More »

Apparel manufacturing software dashboard managing production, inventory, and orders with size and color variants.

Best Apparel Manufacturing Software in 2026: Features, Pricing & Comparison

Compare the top apparel manufacturing software solutions including LS Central, Microsoft Dynamics 365, and industry-specific platforms. Find the perfect ERP system for your fashion, garment, or textile business. Managing an apparel manufacturing business without modern software is like trying to coordinate a fashion show in the dark. You’re juggling size and color matrices, seasonal buying cycles, production scheduling, quality control, multi-channel retail, and complex supply chains — all while fighting razor-thin margins and fast-changing trends. The apparel manufacturing software market offers dozens of solutions: legacy ERP systems, industry-specific platforms, PLM (product lifecycle management) tools, and unified retail-manufacturing platforms. Pricing ranges from $200/month for basic inventory systems to $500,000+ for enterprise implementations. Features vary wildly. And every vendor claims their solution is “built for fashion.” This guide focuses on the best comprehensive solutions for apparel manufacturers — with special emphasis on Microsoft-powered platforms (LS Central and Dynamics 365) that unify manufacturing, retail, and back-office operations. Whether you’re a contract manufacturer, fashion brand, or vertically integrated apparel business, you’ll learn exactly what to look for and which platform fits your needs. What Is Apparel Manufacturing Software? Apparel manufacturing software is a specialized ERP (Enterprise Resource Planning) system designed to manage the unique complexities of fashion, garment, and textile production — from design and sourcing to production planning, quality control, inventory management, and retail distribution. Why Generic ERP Doesn’t Work for Apparel Apparel manufacturing has unique requirements that generic ERP systems can’t handle: What Modern Apparel Manufacturing Software Actually Does Product Development Style management, tech packs, sample tracking, design-to-production workflow, CAD integration. Inventory Management Size/color matrix tracking, lot and serial numbers, warehouse management, multi-location inventory. Production Planning Cutting plans, production orders, capacity planning, shop floor control, work-in-progress tracking. Quality Control AQL sampling, defect tracking, inspection workflows, compliance documentation, traceability. Retail POS & E-commerce Point of sale, omnichannel inventory, online ordering, loyalty programs, customer management. Analytics & Reporting Cost analysis, margin tracking, demand forecasting, production efficiency, sales performance. Integrated vs. Best-of-Breed Approach Some companies use separate systems for PLM (product lifecycle), ERP (manufacturing), and retail (POS). Others prefer a unified platform like LS Central that handles all three. Integrated platforms eliminate integration headaches but may have fewer bells and whistles. Choose based on your complexity and IT resources. Must-Have Features for Apparel Manufacturers in 2026 Not all apparel software is created equal. Here are the non-negotiable features any modern solution must include: ✓ Core Features Checklist Advanced Features (Competitive Differentiators) Top 8 Apparel Manufacturing Software Solutions Compared Here are the leading apparel manufacturing platforms in 2026, with special focus on Microsoft-powered solutions: LS Central for Fashion Best All-in-One: Retail + Manufacturing Custom enterprise pricing Microsoft Dynamics 365 Best Enterprise ERP for Manufacturers $210 per user/month BlueCherry ERP Best Fashion-Specific ERP Custom per user pricing ApparelMagic Best Cloud Platform for SMBs $449 per month (unlimited users) AIMS360 Best for Wholesale Fashion $799 per month (5 users) Infor CloudSuite Fashion Best Enterprise Suite Custom enterprise licensing Backbone PLM Best PLM for Design Teams $125 per user/month Odoo Manufacturing Best Open-Source Option $24.90 per user/month LS Central for Apparel: The Complete Platform LS Central for Fashion is a unified platform built on Microsoft Dynamics 365 Business Central that combines retail POS, manufacturing ERP, and inventory management into one seamless system. It’s the best choice for vertically integrated apparel businesses that both manufacture and sell their products. LS Central for Fashion & Apparel Perfect for: Fashion brands with retail stores, apparel manufacturers selling direct-to-consumer, multi-location apparel chains Key Capabilities: Pricing: Implementation $50,000-$200,000+ (depends on locations, users, customization). Licensing $200-$500/user/month (typically 10-30 users). Implementation Timeline: 3-6 months for standard deployment, 6-12 months for complex multi-location rollouts. Best For: Mid-market to enterprise fashion brands ($10M-$500M revenue), 2-50 retail locations, manufacturing or hybrid manufacturer-retailer model. LS Central vs. Generic ERP for Apparel Requirement LS Central Generic ERP + Customization Size/Color Matrix Built-in, native support Requires custom development Retail POS Integration Unified platform Separate system + integration Omnichannel (Online + Store) Native omnichannel Third-party integration needed Fashion-Specific Workflows Pre-configured for apparel Extensive customization required Implementation Time 3-6 months 6-12+ months (custom development) Total Cost of Ownership Lower (less customization) Higher (ongoing custom maintenance) Why LS Central for Vertically Integrated Brands If you manufacture clothing AND sell it in your own stores or online, LS Central eliminates the need for separate systems. One platform handles production, warehouse, retail POS, e-commerce, and back-office — with zero integration headaches. Your inventory is always accurate across all channels because it’s literally one database. Microsoft Dynamics 365 for Fashion Manufacturing Microsoft Dynamics 365 Supply Chain Management is a comprehensive enterprise ERP platform that can be configured for apparel manufacturing with the right add-ons and customizations. Dynamics 365 for Apparel Manufacturers Best for: Large-scale apparel manufacturers, global operations, complex supply chains, companies already using Microsoft ecosystem Core Capabilities: Fashion-Specific Considerations: Pricing: Licensing: $210-$350/user/month depending on modules Implementation: $150,000-$500,000+ for enterprise deployments Ongoing: 15-20% of license cost annually for support/maintenance Implementation Timeline: 6-12 months for core ERP, 12-18 months for full deployment including customizations When to Choose Dynamics 365 Over LS Central Choose Dynamics 365 if: (1) You’re a pure manufacturer (no retail operations), (2) You need extremely advanced supply chain capabilities, (3) You’re a $500M+ revenue enterprise, (4) You already use Dynamics 365 for finance/operations. For manufacturer-retailers or mid-market brands, LS Central’s out-of-the-box fashion features make it faster and cheaper to implement. Pricing Models: What You’ll Actually Pay Apparel manufacturing software pricing varies dramatically. Here’s the realistic breakdown: Software Licensing (Monthly/Annual) Implementation Costs (One-Time) Hidden Costs to Budget For Total 3-Year Cost of Ownership Examples Small Brand (Startup – 5 users): ApparelMagic: $449/month × 36 months + $10K implementation = $26,164 Mid-Market Brand (50 employees, 5-10 stores): LS Central: $5K/month × 36 months + $100K implementation = $280,000 Enterprise Manufacturer (500+ employees): Dynamics 365: $25K/month × 36 months + $300K implementation = $1,200,000 How to Choose: 10-Step Evaluation Framework Step 1: Define Your Business Model Pure manufacturer? Manufacturer-retailer? Wholesale distributor? Your model determines which features matter most. Step 2: Calculate Your Budget (3-Year TCO) Include implementation, licenses, customization, training, support over 3 years. Don’t just look at monthly fees.

Best Apparel Manufacturing Software in 2026: Features, Pricing & Comparison Read More »

Restaurant POS system dashboard managing orders, payments, and inventory in real time.

Best POS System for Restaurants: Top Solutions & Pricing Guide 2026

Compare the top restaurant POS systems in 2026 – features, pricing, integrations, and real-world performance from fine dining to quick service. Find the perfect solution for your restaurant type and budget. Your restaurant POS system isn’t just a cash register – it’s the operational backbone of your entire business. It processes every order, tracks every dollar, manages your staff, controls your inventory, and shapes your customer experience. Choose the wrong one, and you’ll fight it every day. Choose the right one, and it becomes your competitive advantage. The restaurant POS market in 2026 is crowded with options: cloud-based tablets, legacy on-premise systems, industry-specific platforms, and everything in between. Pricing ranges from $0/month (Square, Toast free plans) to $10,000+ for enterprise installations. Features vary wildly. And every vendor claims to be “the best.” This guide cuts through the noise. Whether you’re running a quick-service restaurant, full-service dining, food truck, bar, café, or multi-location chain, you’ll learn exactly what to look for, which systems dominate each category, and how to choose the solution that fits your operation and budget. 1. What Is a Restaurant POS System? (And Why It Matters) A restaurant point-of-sale (POS) system is the technology hub where orders are taken, payments are processed, and operational data is collected. Modern restaurant POS systems do far more than just ring up sales – they’re comprehensive management platforms that run your entire operation. What Modern Restaurant POS Systems Actually Do Order Management Take orders on tablets, handhelds, or stationary terminals. Send orders directly to kitchen display systems (KDS) or printers by station. Payment Processing Accept credit cards, mobile wallets, contactless payments, and split bills. Handle tips, gift cards, and loyalty rewards. Inventory Tracking Monitor stock levels in real-time, set reorder alerts, track ingredient costs, and integrate with purchasing systems. Staff Management Time clock, shift scheduling, tip pooling, performance tracking, and labor cost optimization. Menu Management Update pricing, add seasonal items, manage modifiers, create combo meals, and sync across all ordering channels. Analytics & Reporting Sales reports, labor costs, food cost percentages, bestsellers, peak hours, and profitability analysis. Table Management Floor plans, reservations, waitlists, table status tracking, and server section assignment. Online Ordering Integrate with delivery platforms (DoorDash, Uber Eats) or run your own online ordering website. Why Your POS Choice Matters Your POS system touches every transaction, employee, and customer. A slow, unreliable, or feature-poor POS creates: longer wait times (customer frustration), order errors (kitchen chaos), payment processing delays (lost revenue), poor reporting (bad decisions), and staff frustration (turnover). Choose wisely – you’ll live with this decision for 3-5+ years. 2. Must-Have Features Every Restaurant POS Needs in 2026 Not all POS systems are created equal. Here are the non-negotiable features any modern restaurant POS must include: ✓ Core Features Checklist Advanced Features (Nice to Have) 3. Top 10 Restaurant POS Systems: Detailed Comparison Here are the leading restaurant POS systems in 2026, ranked by market share and customer satisfaction: Toast POS Best for Full-Service & QSR $69 per terminal/month Square for Restaurants Best for Small Cafés & Casual $60 per terminal/month Clover Best for Quick Service $14.95 per terminal/month Lightspeed Restaurant Best for Multi-Location $69 per terminal/month LS Central Hospitality Best for Enterprise & Chains Custom enterprise pricing Revel Systems Best for QSR Franchises $99 per terminal/month Other Notable Systems 4. Best POS by Restaurant Type Different restaurant types have different needs. Here’s what works best for each: Quick Service Restaurant (QSR) / Fast Casual Best Choice: Toast POS, Square, Clover Why: Need fast order entry, kitchen routing, self-service kiosks, and high transaction volume support. Mobile ordering and delivery integration critical. Full-Service / Fine Dining Best Choice: Toast, TouchBistro, Lightspeed, LS Central Why: Need tableside ordering, complex menu modifiers, split checks, course timing, and sommelier/wine list management. Bar / Nightclub Best Choice: Toast, Square, Lightspeed Why: Need fast bartender workflow, tab management, age verification, and inventory tracking for high-cost liquor. Café / Coffee Shop / Bakery Best Choice: Square, Clover, Toast Why: Need simple, fast checkout, tip prompts, loyalty programs, and low monthly costs. Multi-Location Chain (10+ Locations) Best Choice: LS Central, Toast, Lightspeed, Revel Why: Need centralized reporting, menu management across locations, franchisee portals, and enterprise-grade support. Food Truck / Pop-Up Best Choice: Square, Clover Why: Need mobile hardware, cellular connectivity, battery operation, and low upfront cost. 5. Pricing Models: What You’ll Actually Pay Restaurant POS pricing varies by deployment model, feature set, and processing. Here’s the real breakdown: Monthly Software Costs Payment Processing Fees (The Real Cost) This is where vendors make their money. Don’t just look at software fees – factor in processing: Example: $100,000/month in credit card sales at 2.5% = $2,500/month in processing fees. A 0.3% difference in rates = $300/month = $3,600/year. Processing fees dwarf software costs. Hardware Costs (One-Time) Total hardware for a single POS station: $1,500-$4,000 Hidden Costs to Budget For Total Cost of Ownership (TCO) Example Single-location restaurant (average $50K/month sales): Software $70/month, Processing $1,250/month (2.5% of sales), Hardware $3,000 one-time = $18,840 first year, $15,840 annually thereafter. Always calculate TCO over 3 years, not just monthly software fees. 6. Microsoft Solutions: LS Central for Hospitality & Dynamics 365 For enterprise restaurant operations, Microsoft-powered solutions offer unmatched integration with business systems: LS Central for Hospitality (Recommended for Chains) Best for: Multi-location restaurant chains, hotel restaurants, QSR franchises, central kitchen operations Key Capabilities: Pricing: Implementation: $50,000-$200,000+ (varies by size and complexity) Licensing: $200-$500/user/month (typically 5-20 users per location) Best for: 10+ location chains with $10M+ annual revenue When to Choose LS Central Over Traditional POS Why Choose Microsoft Over Competitors? LS Central integrates seamlessly with tools your corporate team already uses – Excel, Teams, Power BI, Outlook. No learning curve for back-office staff. Plus, it’s built on a unified platform (Dynamics 365 Business Central), so you can add finance, HR, or supply chain modules later without replacing your system. 7. How to Choose: 8-Step Evaluation Framework Step 1: Define Your Restaurant Type & Requirements QSR, full-service, bar, café, multi-location? List must-have features vs. nice-to-haves. Step 2: Calculate Your Budget (TCO, Not Just Monthly Fees) Include software, processing fees, hardware, setup, and 3-year total cost. Step 3:

Best POS System for Restaurants: Top Solutions & Pricing Guide 2026 Read More »

Retail store manager using retail management software dashboard to track inventory, sales, and store performance.

Retail Management Software: Complete Guide to Choosing the Right Solution

Everything you need to know about selecting retail management software in 2026 — from core features and pricing to Microsoft Dynamics 365 solutions, LS Central, and implementation best practices. Running a retail business in 2026 without modern software is like trying to compete in Formula 1 with a bicycle. Your competitors have real-time inventory visibility, omnichannel integration, AI-powered demand forecasting, and automated reordering. Meanwhile, you’re still counting stock manually, reconciling spreadsheets, and wondering why customers are buying online instead of in your store. The retail management software market is crowded with options: cloud-based platforms, legacy on-premise systems, industry-specific solutions, and everything in between. Pricing ranges from $50/month for basic POS systems to $500,000+ for enterprise implementations. Features vary wildly. And every vendor claims to be “the best.” This guide cuts through the noise. Whether you’re a single-store boutique, a multi-location chain, or a retail-manufacturing hybrid, you’ll learn exactly what to look for, which solutions dominate the market, and how Microsoft-powered retail solutions (Dynamics 365 Commerce and LS Central) stack up against the competition. 1. What Is Retail Management Software? (And What It Actually Does) Retail management software is a unified platform that connects all aspects of retail operations — from point of sale (POS) and inventory management to customer relationship management (CRM), e-commerce, and financial reporting — into a single system. Think of it as the operating system for your retail business. Instead of using separate tools for sales, stock tracking, customer data, accounting, and online orders, retail management software consolidates everything into one integrated solution. What Modern Retail Software Actually Does Point of Sale (POS) Process transactions, accept payments, manage discounts, print receipts, handle returns — all from in-store terminals, mobile devices, or web-based interfaces. Inventory Management Real-time stock tracking across all locations, automated reordering, transfer management, barcode scanning, lot/serial tracking, and stock level alerts. Customer Management (CRM) Customer profiles, purchase history, loyalty programs, personalized promotions, email marketing integration, and behavior analytics. Omnichannel Commerce Unify online and offline sales — buy online pick up in store (BOPIS), endless aisle, unified inventory, consistent pricing across all channels. Reporting & Analytics Sales dashboards, inventory reports, customer insights, profit margins, employee performance tracking, and predictive analytics. Financial Integration Automatic accounting sync, tax calculation, expense tracking, financial close automation, and compliance reporting. Why “Retail Management Software” vs. Just “POS”? A POS system handles transactions. Retail management software handles your entire business — sales, inventory, customers, employees, finances, and online/offline integration. If you’re running multiple stores or selling online, a basic POS won’t cut it. You need full retail management. 2. Why Your Retail Business Needs Modern Software in 2026 If you’re still using spreadsheets, legacy software from 2010, or disconnected point solutions for different parts of your business, you’re bleeding money and losing customers. Here’s why: 1. Customers Expect Omnichannel Experiences 72% of consumers shop across multiple channels before making a purchase (Google, 2024). They want to: Without integrated retail software, you can’t deliver this. You lose sales to competitors who can. 2. Manual Inventory Management Costs You 20-30% in Lost Sales Running out of popular items while overstocking slow-movers is expensive. Modern retail software uses AI-powered demand forecasting to predict what you’ll sell and when, automatically generating purchase orders before you run out. 3. Data-Driven Decisions Beat Gut Feel Every Time Which products are most profitable? Which promotions actually drive sales? Which employees convert best? Which store locations outperform? Modern software answers these questions with real-time dashboards and analytics — no more guessing. 4. Labor Costs Are Rising — Automation Is Essential Retail labor costs have increased 15-20% since 2020. Automating repetitive tasks (inventory counts, reordering, customer email campaigns, financial reporting) lets you do more with fewer staff hours. 5. Compliance & Security Requirements Are Stricter PCI-DSS for payment security, GDPR/data privacy regulations, tax compliance, and audit trails are mandatory. Modern retail software handles these automatically — legacy systems don’t. The Cost of Doing Nothing A mid-sized retailer (5-10 stores, $10M revenue) using outdated systems typically loses $150K-$300K annually in: stockouts and overstocking ($80K-$150K), manual labor inefficiency ($40K-$80K), customer churn from poor experience ($20K-$50K), and missed online sales opportunities ($10K-$20K). The software pays for itself in year one. 3. Core Features Every Retail Management System Must Have Not all retail software is created equal. Here are the non-negotiable features any modern solution must include: ✓ Essential Features Checklist Advanced Features (Nice to Have) 4. Cloud vs. On-Premise: Which Deployment Model Is Right for You? This is one of the first decisions you’ll face. Here’s the honest breakdown: Factor Cloud-Based On-Premise Upfront Cost Low ($0-$5K) High ($20K-$100K+) Monthly Cost $50-$500/month per location $0 (after purchase) Implementation Time 1-4 weeks 2-6 months Updates & Maintenance Automatic, free Manual, $5K-$20K/year Accessibility Anywhere with internet Only on-site or via VPN Scalability Add stores instantly Requires hardware/licenses Internet Dependency Required (offline mode limited) Works offline Data Control Vendor-hosted Full control on your servers Customization Limited to vendor options Unlimited (with developers) Our Recommendation For 95% of retailers, cloud-based is the right choice. Lower upfront cost, faster implementation, automatic updates, and no IT infrastructure to maintain. The only exceptions: 5. Microsoft Retail Solutions: Dynamics 365 Commerce & LS Central Microsoft offers two primary retail solutions built on the Dynamics 365 platform. Here’s how they differ and which one is right for you: Microsoft Dynamics 365 Commerce Best for: Mid-market to enterprise retailers with complex omnichannel operations, especially those already using other Dynamics 365 modules (Finance, Supply Chain, Customer Service). Key Capabilities: Ideal Customer Profile: Enterprise retailers (50+ stores or $100M+ revenue), omnichannel brands, B2C companies needing sophisticated digital commerce. Pricing: Custom enterprise pricing (typically $150K-$500K+ implementation, $5K-$20K/month ongoing licensing). LS Central (by LS Retail, built on Dynamics 365 Business Central) Best for: Small to mid-market retailers in specialized verticals (fashion, grocery, hospitality, fuel/convenience) who need industry-specific functionality out of the box. Key Capabilities: Ideal Customer Profile: Growing retailers (1-50 stores), fashion/apparel brands, grocery chains, specialty retail, hospitality businesses. Pricing: $50K-$150K implementation, $200-$500/user/month (typically 5-20 users). Which Microsoft Solution Should You Choose? Your Situation Recommended Solution 1-20 stores, fashion/apparel vertical LS Central Grocery,

Retail Management Software: Complete Guide to Choosing the Right Solution Read More »

Sales team using Copilot in Dynamics 365 to automate CRM workflows and analyze customer data.

Beyond the Hype: 5 Real-World Sales Workflows We Automated Using Copilot in D365

Actual automation use cases from our clients – complete with before/after metrics, implementation steps, and honest assessments of what Copilot does well (and where it still needs help). Every vendor is talking about AI. Microsoft’s pitching Copilot as a revolution in sales productivity. Your LinkedIn feed is full of posts about “AI-powered everything.” But when you ask sales leaders what they’ve actually automated with Copilot, you get vague answers about “email summaries” and “meeting notes.” Here’s the truth: Copilot in Dynamics 365 Sales is powerful, but it’s not magic. It won’t transform your sales process overnight. It won’t fix bad data or broken workflows. And it definitely won’t replace the need for good salespeople who understand their customers. What it will do – when implemented thoughtfully – is eliminate hours of administrative busywork, surface insights your reps would have missed, and help your team sell faster without working harder. This article shares five specific workflows we’ve automated for clients using Copilot in Dynamics 365 Sales. These aren’t theoretical use cases from Microsoft’s marketing materials. They’re real implementations with actual before/after metrics, honest assessments of what worked (and what didn’t), and step-by-step breakdowns you can replicate. 1. Automated Lead Qualification & Scoring The Problem A B2B software company was generating 400-500 inbound leads per month from multiple sources (website forms, trade shows, webinars, paid ads). Their SDR team of 4 people was spending 6-8 hours per day manually researching leads, reading company websites, checking LinkedIn, and trying to determine which leads were worth calling first. Result: High-value leads sat in the queue for 2-3 days before anyone reached out. By the time they got a call, 30% had already engaged with a competitor. Before Copilot Manual process: SDR receives lead → Googles company → Checks LinkedIn → Reads “About Us” page → Estimates company size and budget → Manually scores lead in spreadsheet → Enters score into D365 → Finally calls lead (24-72 hours later) With Copilot Automated process: Lead enters D365 → Copilot enriches with firmographic data (revenue, employee count, industry, tech stack) → Analyzes fit against ideal customer profile → Auto-assigns lead score → Routes to appropriate SDR → SDR calls within 2 hours with context already loaded How We Implemented It The Results Measured Impact (90 Days Post-Implementation) 87% Reduction in lead research time 2 hrsAverage lead response time (vs. 48 hrs before) 42 %Increase in lead-to-opportunity conversion $180K Additional pipeline value in first quarter What Didn’t Work Initially Copilot’s auto-scoring was too aggressive at first — it scored leads based on company size alone, ignoring buying signals. We had to refine the criteria twice before it matched our SDRs’ judgment. Also, data enrichment only works if the lead provides a company email (not Gmail/Yahoo). We now route personal email leads to a separate qualification flow. 2. Intelligent Email Follow-Up & Next-Best-Action Recommendations The Problem A manufacturing equipment distributor’s sales reps were managing 40-60 active opportunities each. They’d send a proposal, schedule a demo, or have a discovery call — then forget to follow up. Opportunities would go stale for 2-3 weeks before anyone noticed. The sales manager was manually reviewing pipeline every Monday and sending “you need to follow up on X” reminders to reps. Reps complained they couldn’t remember the context of every conversation when they did follow up weeks later. How We Automated It Before Copilot Rep sends proposal → Gets busy with other deals → Forgets to follow up → Customer goes silent → Two weeks later, sales manager asks “What happened with ABC Corp?” → Rep scrambles to piece together what happened → Customer already bought from competitor With Copilot Rep sends proposal → Copilot reminds rep to follow up in 3 days → Suggests email: “Hi [Name], following up on the proposal we discussed for [specific pain point]” → Rep reviews, edits slightly, sends → Customer responds with questions → Copilot flags as “hot opportunity” and moves to top of rep’s queue The Results Measured Impact (6 Months Post-Implementation) 73% Reduction in stale opportunities (no activity 14+ days) 3.2x More follow-up touches per opportunity 18% Improvement in win rate 4.5 hrs Saved per rep per week (no more manual pipeline review) Unexpected Benefit Reps started using Copilot-generated email summaries to brief their managers before pipeline reviews. Instead of the manager asking “What’s the status of this deal?”, reps could instantly share a 3-sentence AI summary. This cut pipeline review meetings from 90 minutes to 30 minutes and made them far more strategic. 3. Automated Meeting Prep & Post-Meeting Follow-Up The Problem An enterprise software company’s AEs were running 8-12 customer meetings per week. They’d show up to calls without reviewing the customer’s history, previous conversations, or open issues. Customers would say “I mentioned this on our last call” and the AE would have to ask them to repeat it. Post-meeting, reps were supposed to send recap emails and update D365, but often forgot or did it days later when details were fuzzy. How We Automated It Implementation Steps Enable Copilot for Sales in D365 + Teams Integration Connected Copilot to Microsoft Teams for call transcription and recording access. Configured permissions so Copilot can read calendar events and D365 records. Define Meeting Brief Template Worked with sales team to determine what information they actually want to see before calls. Created template that pulls: customer industry, previous meeting notes (last 3 meetings), open opportunities, outstanding quotes, support ticket summary. Train Copilot on Recap Email Format Provided examples of good recap emails. Copilot learned the structure: brief thank you, summary of what was discussed, clear next steps, timeline/deadline if applicable. Set Up Competitive Intelligence Triggers Created list of competitor names and product names. When mentioned in meetings, Copilot tags the opportunity and pulls battlecard information from SharePoint. The Results Measured Impact (4 Months Post-Implementation) 92% Of reps now review meeting brief before every call 3.5 hrs Saved per rep per week (meeting prep + recap writing) 68% Increase in same-day meeting recaps (vs. 22% before) 34% Reduction in “Can you remind me what we

Beyond the Hype: 5 Real-World Sales Workflows We Automated Using Copilot in D365 Read More »

AI-powered computer vision system detecting product defects on a manufacturing production line in real time.

AI-Powered Defect Detection Using Computer Vision: How It Works & Why It’s Better

A comprehensive guide to computer vision defect detection for manufacturing quality control — how the technology works, why it outperforms human inspection, and what results you can expect. Manual quality inspection is slow, expensive, and inconsistent. A trained inspector can check 300-500 parts per hour. They get tired. They miss defects. And when your production line runs 24/7, you need multiple inspection shifts — each with their own interpretation of what counts as a defect. AI-powered defect detection using computer vision changes this equation completely. One camera system can inspect 3,000-10,000 parts per hour with 99%+ accuracy. It never gets tired. It never has a bad day. And it applies the exact same quality standard to every single part, every hour, every shift. But here’s what manufacturing leaders really want to know: How does it actually work? Is it really better than experienced inspectors? What’s the ROI? And what’s required to implement it? This guide explains the technology in practical terms — how computer vision detects defects, why AI makes it more accurate than traditional machine vision, and the business case for replacing manual inspection with automated systems. How AI-Powered Computer Vision Defect Detection Works At its core, computer vision defect detection uses cameras and AI algorithms to automatically identify flaws in manufactured products. Here’s the step-by-step process: Image Capture High-resolution cameras (often multiple cameras at different angles) capture images of each part as it moves down the production line. Typical capture speed: 0.1-0.5 seconds per part. Preprocessing The AI system preprocesses the image — adjusting for lighting variations, enhancing contrast, removing noise, and isolating the part from the background. Feature Extraction The computer vision algorithm identifies key features in the image: edges, surfaces, textures, colors, patterns. This is where deep learning neural networks excel — they automatically learn which features matter for defect detection. Defect Classification The AI model compares the extracted features against its trained database of “good” and “defective” examples. It classifies the part as pass/fail and identifies specific defect types (scratch, dent, misalignment, color variation, etc.). Action & Logging If a defect is detected, the system triggers an action: reject the part (pneumatic kicker, diverter gate), alert an operator, or log the defect for analysis. All inspections are timestamped and stored for traceability. This entire process happens in milliseconds — fast enough to inspect parts on high-speed production lines running 100+ parts per minute. What Makes It “AI-Powered”? Traditional machine vision uses rule-based algorithms (if X pixels differ from template, reject). AI-powered systems use deep learning — they learn what defects look like by analyzing thousands of examples. This makes them far more accurate at detecting subtle or variable defects that rule-based systems miss. Computer Vision vs. Manual Inspection: The Reality Let’s compare computer vision defect detection against manual human inspection across the metrics that actually matter to manufacturers: Metric Manual Inspection Computer Vision + AI Inspection Speed 300-500 parts/hour 3,000-10,000 parts/hour Accuracy 80-95% (varies by fatigue, experience) 95-99.9% (consistent) Consistency Decreases over shift, varies by inspector Identical standard applied 24/7 Cost (per year) $45K-$75K per inspector × 3 shifts = $135K-$225K $50K-$150K (amortized system cost + maintenance) Scalability Requires hiring/training for increased volume Add cameras as needed, no retraining Data & Traceability Limited logging, manual records 100% inspections logged with images and timestamps Defect Types Surface defects, obvious flaws Microscopic defects, color variations, dimensional accuracy Implementation Time Immediate (hire + 1-2 weeks training) 2-6 months (system design, training, integration) The Bottom Line Computer vision is 20-30x faster, 15-30% more accurate, and 40-60% cheaper than manual inspection at scale. The tradeoff is upfront investment and implementation complexity. 20x Faster inspection speed vs. manual 99%+ Accuracy rate (vs. 80-95% manual) 50% Lower cost per inspection at high volumes 100% Inspection traceability with timestamped data Types of Defects Computer Vision Can Detect Modern AI-powered computer vision systems can detect a wide range of defect types — some that human inspectors struggle to catch consistently: Surface Defects Scratches, dents, pits, burrs, cracks, contamination, rust, corrosion, discoloration Dimensional Defects Size variations, incorrect measurements, misalignment, warping, thickness deviations Color & Texture Defects Uneven coating, color inconsistency, texture variations, gloss differences, paint defects Assembly Defects Missing components, incorrect parts, misaligned assemblies, inverted components, wrong orientation Print & Label Defects Smudged printing, incorrect text, barcode errors, missing labels, misaligned graphics Packaging Defects Seal integrity, fill level, torn packaging, label placement, wrong product in package Microscopic Defects One major advantage of computer vision: it can detect defects invisible to the naked eye. With high-resolution cameras and magnification, systems can identify: Real-World Example An automotive supplier implemented computer vision for brake pad inspection. The system detects surface cracks as small as 0.05mm — defects human inspectors only caught 60% of the time. Result: 98% defect detection rate and zero customer warranty claims from missed defects in the first year. The Technology Behind It: AI, Deep Learning & Neural Networks Understanding the technology helps explain why AI-powered systems outperform traditional machine vision and manual inspection. Traditional Machine Vision vs. AI Computer Vision Traditional Machine Vision (Rules-Based) Uses predefined algorithms and templates. Example: “If more than 50 pixels differ from the reference image by more than 10% brightness, flag as defect.” Limitation: Works well for simple, predictable defects. Struggles with variable defects, complex parts, or lighting changes. AI-Powered Computer Vision (Learning-Based) Uses deep learning neural networks trained on thousands of images. The AI learns what “good” and “defective” look like without explicit programming. Advantage: Handles complex, variable defects. Adapts to new defect types. Works across different lighting and part variations. How the AI Training Process Works Training Data Is Critical The quality of your defect detection system depends on the quality and quantity of training data. Systems trained on 10,000 diverse examples outperform those trained on 1,000. Budget time and resources for proper data collection — it’s the most important step. Key Technologies Used Implementation: What You Actually Need Implementing computer vision defect detection isn’t plug-and-play, but it’s not rocket science either. Here’s what’s required: Hardware Requirements Industrial Cameras High-resolution cameras (2MP-12MP+) with proper lenses for your part size and inspection

AI-Powered Defect Detection Using Computer Vision: How It Works & Why It’s Better Read More »

CFO reviewing financial dashboards while planning migration from Dynamics AX to D365 Finance and Operations to protect cash flow.

The CFO’s Guide: Moving from Dynamics AX to D365 F&O Without Disrupting Cash Flow

A financial executive’s roadmap to migrating from legacy Dynamics AX to D365 Finance & Operations — managing costs, timelines, and operational continuity without risking your quarter. Why CFOs Can’t Delay the AX to D365 Migration Let’s address the question every CFO asks: “Can we push this migration to 2027 or 2028?” Technically, yes. Microsoft extended support for Dynamics AX 2012 runs through October 2027. But waiting until the deadline is a financial mistake for three reasons: 1. Implementation Partners Are Already Booked Solid The best Dynamics 365 implementation partners are scheduling projects 9-12 months out. If you wait until 2026, you’ll be competing with hundreds of other companies for limited partner capacity. The result? Higher costs, longer wait times, and settling for second-tier partners. 2. Your Competitors Are Gaining Operational Advantages Now Companies that migrated to D365 F&O in 2023-2024 are already seeing benefits: faster financial close (30-40% reduction), automated cash flow forecasting, real-time reporting, and AI-powered insights. Every quarter you delay is a quarter they’re pulling ahead operationally. 3. Running Unsupported Software Is a Compliance and Security Risk After October 2027, Microsoft will no longer provide security patches or compliance updates for AX 2012. For publicly traded companies or those in regulated industries (finance, healthcare, government contracting), running unsupported ERP software creates audit failures, regulatory violations, and cybersecurity exposure that can’t be insured away. Real Cost of Waiting A mid-market manufacturer delayed their AX migration until 2026. By the time they started procurement, their preferred implementation partner was fully booked. They settled for a less experienced firm, the project ran 4 months over schedule, and the budget overrun was 42%. The CFO later admitted: “We saved nothing by waiting. We just made it more expensive and more painful.” The Window Is Closing If you start planning now (Q1-Q2 2025), you can execute a controlled migration in 2025-2026 with your choice of partners, negotiated pricing, and phased implementation that protects cash flow. If you wait until 2026, you’re at the mercy of whoever has capacity and whatever they charge. The Financial Risks of Poor Migration Planning ERP migrations fail not because of technology, but because of poor financial planning and unrealistic expectations. Here are the hidden costs that blindside CFOs who treat this as an IT project instead of a business transformation: 35% Average budget overrun on poorly planned ERP migrations 4-6 Months of reduced productivity during cutover (if poorly managed) $250K+ Hidden costs (training, data cleanup, process redesign) Where Migrations Blow Up Financially 1. Underestimating Data Migration Complexity Your AX database has 10-15 years of transactional data, custom fields, and integrations that won’t migrate cleanly. Data cleanup, mapping, and validation typically accounts for 25-35% of total project cost — but most initial budgets allocate only 10-15%. 2. Ignoring Change Management & Training Your finance team has muscle memory built around AX 2012. D365 F&O workflows are different — not just an upgrade, but a new way of working. Without proper training, you’ll see: data entry errors, missed closing deadlines, and team frustration that leads to turnover. Budget 15-20% of total project cost for training and change management. 3. Customizations That Don’t Transfer Every custom report, workflow, or integration in AX needs to be rebuilt or replaced in D365. Some can be replaced with out-of-the-box D365 features (good). Others require custom development (expensive). A thorough customization audit before migration prevents budget surprises. 4. Not Planning for Dual-System Operations During migration, you’ll run AX and D365 in parallel for 1-3 months. This means: double data entry, reconciliation between systems, and extra staff hours. Factor this into both budget and resource planning. CFO Pro Tip Add a 20-25% contingency to your initial migration budget. This isn’t pessimism — it’s reality. The projects that come in on budget are the ones that planned for the unexpected from day one. The ones that blow up are the ones where the CFO insisted on an “aggressive” budget to impress the board. Real-World Migration Costs: What You’ll Actually Pay Every CFO wants a number. Here it is — with the caveat that your actual costs depend on company size, complexity, and how much custom work you’ve done in AX. Migration Cost Breakdown (Mid-Market Company, $50M-$500M Revenue) Total Migration Budget D365 F&O Licensing (annual) $100K – $300K Implementation Services $250K – $750K Data Migration & Cleanup $75K – $150K Customizations & Integrations $100K – $300K Training & Change Management $50K – $100K Project Management (Internal) $75K – $125K Contingency (20%) $130K – $345K Total First-Year Cost $780K – $2.07M Cost Variables That Move the Needle Benchmark Reality Check According to Panorama Consulting’s 2024 ERP Report, the average mid-market D365 F&O implementation costs $850K and takes 10 months. Companies that budget below $500K or plan for under 6 months are setting themselves up for failure. Price competitively, but don’t chase the lowest bid — it always costs more in the end. Protecting Cash Flow: Phasing & Payment Structures The worst financial mistake CFOs make is treating ERP migration as a single, massive capital expenditure. Instead, structure it as a phased investment that aligns payments with deliverables and minimizes cash flow impact. Payment Structure Strategy Option 1: Milestone-Based Payments (Recommended) Tie payments to project milestones, not calendar dates. This protects you if the project runs late and aligns vendor incentives with your success. Milestone Payment % When Contract Signing 10-15% Upfront deposit Design Approval 20-25% After solution design sign-off UAT Completion 25-30% After user acceptance testing Go-Live 20-25% Day 1 of production use Post-Go-Live (30 days) 15-20% After stabilization period Option 2: Quarterly Phasing (For Budget Predictability) Spread payments across fiscal quarters to smooth cash flow impact. Negotiate fixed quarterly payments regardless of project progress — this shifts schedule risk to the vendor but requires careful SOW definition. Licensing: Annual vs. Monthly Payment Microsoft offers both annual and monthly D365 F&O licensing. CFOs often default to annual payments for the discount (typically 10-12%), but monthly payments provide flexibility during migration: This approach costs slightly more in Year 1 but provides optionality if

The CFO’s Guide: Moving from Dynamics AX to D365 F&O Without Disrupting Cash Flow Read More »

Warehouse manager using ERP dashboard to track inventory, shipments, and real-time supply chain performance.

7 Biggest Challenges in Logistics & Supply Chain Management (And How ERP Solves Them)

From visibility gaps to inventory nightmares — here’s what every logistics manager and supply chain professional struggles with, and the technology that’s transforming operations worldwide. If you manage logistics operations, run a supply chain, or oversee freight and distribution, you already know this truth: logistics and supply chain management is one of the most complex, high-pressure jobs in business. You’re coordinating hundreds of moving parts — shipments, warehouses, suppliers, carriers, customs, customers — often across multiple countries and time zones. A single delay, inventory error, or communication breakdown can cascade into thousands of dollars in losses, missed commitments, and damaged customer relationships. Yet many logistics companies are still managing these operations with disconnected systems: spreadsheets for tracking, emails for communication, separate software for warehouse management, transportation, and accounting. Every handoff is a risk. Every manual process is an opportunity for error. And every delay is invisible until it’s too late. Modern ERP systems for logistics and supply chain management are changing this. They’re unifying disparate operations into a single platform, giving you real-time visibility, automating manual tasks, and turning supply chain data into actionable insights. But before we talk about solutions, let’s be honest about the challenges. Lack of Real-Time Visibility Across the Supply Chain This is the number one complaint from logistics managers everywhere: “I don’t know where my shipments are.” When shipments move through multiple carriers, modes of transport (truck, rail, air, ocean), warehouses, and customs checkpoints, keeping track of everything in real time is nearly impossible with traditional systems. You’re relying on manual updates from drivers, emails from freight forwarders, and phone calls to warehouse managers. By the time you realize there’s a delay, the customer is already calling you asking where their order is. The Real Problem Without real-time visibility, you’re always operating in the past. You can’t proactively solve problems — you can only react to them after they’ve already hurt your business. Customers lose trust. Your team wastes hours tracking down information. And preventable delays become expensive emergencies. Why visibility breaks down: How ERP Solves This Supply chain ERP systems integrate with carriers, warehouse management systems, and supplier portals to pull live shipment data into a single dashboard. You see where every order is, in real time — from purchase order to final delivery. Automated tracking updates flow into the system without manual intervention. Alerts notify you the moment a delay happens, so you can reroute, communicate with customers, or adjust inventory plans before it becomes a crisis. Inventory Management Across Multiple Warehouses & Locations Managing inventory is simple when you have one warehouse. It becomes exponentially harder when you have multiple facilities, distribution centers, or 3PL partners — each with their own inventory counts, systems, and stock levels. The challenge isn’t just knowing what you have. It’s knowing where it is, how much is in transit, what’s committed to existing orders, and what’s actually available to sell or ship. One wrong inventory count and you’re either overstocked (tying up capital in dead inventory) or facing stockouts (losing sales and disappointing customers). The Real Problem Without unified inventory visibility, you make decisions based on incomplete information. You might promise a customer a delivery date only to find out the inventory is in the wrong warehouse. Or you reorder stock you don’t actually need because your system didn’t account for in-transit inventory. These errors cost money, delay shipments, and erode customer trust. Common inventory nightmares: How ERP Solves This Warehouse management ERP modules provide a single source of truth for all inventory across all locations. You see real-time stock levels in every warehouse, what’s in transit between facilities, what’s committed to open orders, and what’s available to promise. The system automatically tracks stock movements, reorder triggers, and batch/lot traceability. When you move inventory between warehouses, it updates instantly across finance, sales, and operations — no manual reconciliation needed. Manual Processes That Slow Everything Down Logistics is drowning in manual processes. Data entry. Status updates. Invoice reconciliation. Shipment documentation. Customs paperwork. Every handoff between warehouse, transport, finance, and customer service involves manual data transfer — often re-entering the same information into multiple systems. This isn’t just slow. It’s error-prone. A typo in a customs document delays a shipment. A data entry mistake leads to invoicing errors. A missed email means a critical update never gets communicated. The Real Problem Manual processes don’t scale. When your business grows, the workload multiplies but the hours in the day don’t. Your team spends more time updating spreadsheets than solving problems. Errors increase. Response times slow. And your competitors who’ve automated their operations outpace you. Where manual work kills productivity: How ERP Solves This Logistics ERP software automates the repetitive, manual tasks that consume your team’s time. When an order is placed, the system automatically generates shipping documents, assigns warehouse picking tasks, updates inventory, triggers carrier bookings, and sends tracking notifications to customers — without human intervention. Invoice reconciliation happens automatically by matching shipments to carrier invoices. Your team focuses on exceptions and strategy, not data entry. Poor Communication & Coordination Between Teams In logistics operations, silos are deadly. The warehouse team doesn’t know what sales promised the customer. The transport team doesn’t know finance hasn’t approved the shipment. Purchasing doesn’t know operations urgently needs a part. Everyone is working hard, but they’re not working together. Most communication happens through email threads that grow too long to follow, spreadsheets shared via Dropbox, and urgent Slack messages that get buried in noise. Critical information gets lost. Decisions are made on outdated data. And when something goes wrong, nobody has the full picture. The Real Problem Communication breakdowns lead to operational failures. A warehouse ships the wrong product because they didn’t see the order update. A driver sits idle because dispatch didn’t know the load was ready. Finance blocks a shipment because they weren’t notified it was pre-approved. Each failure costs time, money, and customer satisfaction. Why communication fails: How ERP Solves This ERP in logistics and supply chain management creates a shared workspace where all teams operate from

7 Biggest Challenges in Logistics & Supply Chain Management (And How ERP Solves Them) Read More »

AI-powered CCTV video analytics with real-time alerts and reporting.

Best Video Analytics Software for CCTV: Features, Pricing & Integration

A comprehensive guide to choosing AI-powered video analytics software for your existing CCTV infrastructure — covering features, pricing models, integration requirements, and ROI expectations. If you’ve invested in CCTV cameras for your business, warehouse, retail store, or facility, you already have the hardware foundation for something much more powerful: AI-powered video analytics. Traditional CCTV systems simply record footage. Video analytics software transforms those cameras into intelligent sensors that can detect events, count people, recognize faces, monitor safety compliance, and alert you to security threats — all in real time, without human monitoring. The challenge? There are dozens of video analytics solutions on the market, each with different capabilities, pricing structures, and integration requirements. Some work seamlessly with your existing cameras. Others require expensive hardware replacements. Some offer basic motion detection. Others provide advanced AI-powered analytics like heat mapping, crowd density analysis, and behavioral anomaly detection. This guide will help you navigate the options, understand what features matter for your use case, and choose the right video analytics software without overpaying or getting locked into the wrong system. What Is Video Analytics Software for CCTV? Video analytics software — also called surveillance camera analytics, AI video analytics, or intelligent video analytics — is software that analyzes live or recorded video feeds from your CCTV cameras and automatically detects specific events, objects, or behaviors. Instead of requiring human operators to watch hours of footage, video analytics software uses computer vision and artificial intelligence to understand what’s happening in the video feed and trigger alerts or actions based on predefined rules. How It Works Video analytics software sits between your CCTV cameras and your monitoring system. It processes the video stream in real time, identifying: When the software detects something significant, it triggers an alert (email, SMS, push notification) or initiates an automated response (locking doors, sounding alarms, recording specific camera feeds). Key Difference: Edge vs. Server-Based Analytics Edge analytics runs on the camera itself or a local device, processing video at the source. Server-based analytics processes video on a centralized server or cloud platform. Edge is faster and more privacy-friendly; server-based is more flexible and scalable for large deployments. Why Upgrade from Basic CCTV to AI-Powered Analytics? Traditional CCTV systems are passive. They record footage, and if something goes wrong, you review the recordings after the fact. By the time you see the incident, the damage is done. AI-powered video analytics turns your cameras into proactive monitoring systems. Here’s what changes: Real-Time Alerts Get notified the moment something happens — not hours later when you review footage. Stop incidents before they escalate. Reduce Labor Costs Eliminate the need for 24/7 human monitoring. AI watches your cameras and only alerts you when something requires attention. Actionable Insights Understand traffic patterns, peak hours, customer behavior, and operational bottlenecks — data you can’t get from passive recording. Enhanced Security Detect intrusions, abandoned objects, perimeter breaches, and suspicious behavior automatically — even in low-light conditions. Real-World ROI Examples Core Features to Look For in Video Analytics Software Not all video analytics platforms are created equal. Here are the must-have features and nice-to-have advanced capabilities you should evaluate: Essential Features (Must-Have) Security & Surveillance People & Vehicle Analytics Advanced Features (Nice-to-Have) Beware of Feature Bloat Many vendors advertise 50+ features, but you’ll realistically use 5–7. Focus on what solves YOUR problems — don’t pay for capabilities you won’t use. Start simple and scale up as needed. 1. Security & Surveillance (All Industries) 2. Retail Stores 3. Manufacturing & Warehouses 4. Healthcare Facilities 5. Office Buildings & Corporate Campuses Integration Guide: Will It Work With Your Existing Cameras? This is the #1 question businesses ask: “Can I use my existing CCTV cameras, or do I need to replace everything?” The good news: Most modern video analytics software works with existing IP cameras, as long as they meet basic technical requirements. Camera Compatibility Checklist Requirements for Analytics Compatibility Common Integration Scenarios Scenario 1: Modern IP Cameras (2018+) Compatibility: Excellent. Most analytics software will work out of the box.Action: Verify ONVIF compliance and check vendor compatibility list. Scenario 2: Older IP Cameras (2015–2018) Compatibility: Likely compatible, but may have limitations (lower resolution, slower processing).Action: Test with a pilot deployment before full rollout. Scenario 3: Analog Cameras Compatibility: Not directly compatible.Action: Use a video encoder or hybrid NVR to convert analog signals to IP, OR upgrade cameras. Scenario 4: Mix of Camera Types Compatibility: Partial compatibility.Action: Deploy analytics on compatible IP cameras first; upgrade analog cameras as budget allows. What About NVR/DVR Integration? Many analytics platforms integrate with your existing NVR (Network Video Recorder) or VMS (Video Management System). The software pulls video streams from the NVR rather than connecting directly to each camera. This simplifies deployment and centralizes management. Pricing Models: What You’ll Actually Pay Video analytics pricing varies widely based on deployment model, features, and scale. Here’s a breakdown of common pricing structures: Per Camera / Month $15–$50 per camera/month Per Server License $5K–$25K one-time + annual support Enterprise Custom Custom negotiated pricing Hidden Costs to Account For Total Cost of Ownership (TCO) Don’t just compare software licensing costs. Calculate TCO over 3–5 years, including hardware upgrades, storage, bandwidth, support, and training. A cheaper solution upfront can be more expensive long-term if it requires proprietary cameras or lacks scalability. Top Video Analytics Software Solutions Compared Here’s a high-level comparison of leading video analytics platforms. Note that this is not exhaustive — there are dozens of solutions, but these represent the most established and widely deployed options. Platform Deployment Key Strengths Best For Pricing Milestone XProtect On-Premise Open platform, wide camera compatibility Mid-large enterprises Per server license Genetec Security Center On-Prem / Cloud Unified security (access control + video) Corporate campuses Custom enterprise Eagle Eye Networks Cloud Easy deployment, no servers needed Small-mid businesses Per camera/month Verkada Cloud (Hybrid) Plug-and-play, modern UI, built-in cameras Offices, retail chains Per camera/year OpenALPR On-Prem / Cloud License plate recognition specialist Parking, logistics Per camera/month Custom AI Solutions On-Premise Tailored to specific use cases Niche industries Custom project-based How to Choose Don’t pick based on brand recognition alone. Define your use case,

Best Video Analytics Software for CCTV: Features, Pricing & Integration Read More »

Modern ERP optimizing inventory and production in sweet manufacturing.

7 Biggest Challenges in Sweet Manufacturing (And How Modern ERP Solves Them)

From recipe consistency to seasonal demand spikes — here’s what every halwai, mithai shop, and namkeen manufacturer struggles with, and the technology that’s changing the game. If you run a sweet shop, halwai business, or namkeen manufacturing unit, you already know this: the sweet industry is unlike any other. You’re not just managing inventory or sales — you’re juggling perishable ingredients, complex recipes, seasonal demand swings, and quality standards that can make or break your reputation. A single batch that tastes different from the last can cost you loyal customers. Overproduction during slow months leads to waste. Underproduction during Diwali or Eid means lost revenue and disappointed buyers. And all of this has to happen while meeting food safety regulations, managing multiple retail outlets, and keeping costs under control. These aren’t small operational hiccups — they’re challenges that directly impact your bottom line, your brand, and your ability to scale. The good news? Modern ERP systems — specifically designed for food manufacturing and retail — are solving these problems for sweet businesses across India and beyond. In this article, we’ll break down the 7 biggest challenges sweet manufacturers and retailers face, and show you exactly how technology is transforming traditional mithai businesses into efficient, profitable operations. Recipe Consistency Across Every Batch This is the number one challenge every sweet manufacturer faces. Your gulab jamun, barfi, or namkeen needs to taste exactly the same whether it’s made on Monday or Friday, by your head chef or a new team member, in your flagship outlet or a branch location. But traditional sweet businesses rely on master halwais who carry recipes in their heads — or worse, on handwritten notebooks that get lost, stained, or misinterpreted. When that expert takes a day off or leaves the company, the recipe knowledge leaves with them. The Real Problem Inconsistent recipes lead to complaints, returns, and lost customers. A customer who buys your ladoo expecting a specific taste and texture will go elsewhere if the next batch is different. In the sweet business, consistency IS your brand. Why this happens: How ERP Solves This Modern ERP systems include recipe management modules that digitize every formulation. You define exact ingredient quantities, preparation steps, and quality checkpoints. When a batch is produced, the system ensures the correct ratios are used — every single time. If you need to substitute an ingredient, the system recalculates quantities automatically and tracks the change. No guesswork. No inconsistency. Managing Perishable Inventory Without Waste Unlike most manufacturing industries, sweet businesses deal with ingredients and finished products that have extremely short shelf lives. Milk, khoya, fresh fruits, nuts — these expire fast. Finished sweets can’t sit on shelves for weeks. Every day that passes reduces quality and increases the risk of spoilage. The challenge gets worse when you operate multiple outlets. How do you ensure each location has enough stock to meet demand without overproducing? How do you track expiry dates across warehouses and retail counters? The Real Problem Inventory wastage directly eats into your profit margins. If you throw away 10% of your daily production due to expiry or overstock, you’re essentially giving away 10% of your revenue. For most sweet shops, this can mean lakhs of rupees lost every year. Common inventory nightmares: How ERP Solves This ERP systems track inventory in real-time across all locations. You get automatic alerts when ingredients are approaching expiry dates. The system uses FIFO (First In, First Out) logic to ensure older stock is used first. Demand forecasting — based on historical sales data — helps you produce the right quantities. You can see exactly what’s in each outlet, what’s in transit, and what needs to be ordered — all from a single dashboard. Seasonal Demand Planning (Diwali, Eid, Weddings) The sweet industry is intensely seasonal. During Diwali, your sales might spike by 400%. During Eid or wedding season, you’re operating at maximum capacity. But for most of the year, demand is steady and predictable. This creates a planning nightmare. How much raw material should you stock before the festive rush? How many extra workers do you need? Which products will sell the most? If you under-prepare, you lose sales. If you over-prepare, you’re stuck with excess inventory that goes to waste. The Real Problem Missing the festive season rush is catastrophic for sweet businesses. Diwali alone can account for 30–40% of annual revenue for many shops. Stockouts during this period don’t just lose immediate sales — they push customers to competitors, potentially losing them forever. Why seasonal planning fails: How ERP Solves This ERP systems use historical data and demand forecasting to predict seasonal spikes accurately. You can see which products sold best last Diwali, how much raw material you needed, and when orders peaked. The production scheduling module helps you ramp up capacity ahead of time. Inventory is pre-ordered based on forecasts. Labor planning is optimized. Instead of reacting to chaos, you’re prepared weeks in advance. Food Safety Compliance & Batch Traceability Food safety isn’t optional — it’s the law. FSSAI regulations in India (and similar laws globally) require sweet manufacturers to maintain full traceability from raw materials to finished products. If there’s a quality issue or a customer complaint, you need to be able to trace which batch it came from, which ingredients were used, and when it was produced. For traditional sweet businesses operating on paper records or memory, this is almost impossible. When an inspector shows up, or a customer reports a problem, can you instantly pull up the production history? The Real Problem Non-compliance with food safety regulations can result in heavy fines, license suspension, or even business closure. Beyond legal risks, a single contamination incident — if not handled with proper traceability — can destroy your brand reputation overnight. Compliance challenges: How ERP Solves This ERP systems automate batch tracking and compliance. Every ingredient lot is logged when it arrives. During production, the system records which ingredients went into which batch. If a quality issue arises, you can instantly trace the entire supply chain — which supplier, which production date, which retail outlets received it. Quality control

7 Biggest Challenges in Sweet Manufacturing (And How Modern ERP Solves Them) Read More »