Welcome to Trident Information Systems!
Write us to - info@tridentinfo.com
Let's Socialize

Business Intelligence

Microsoft Power Platform and Microsoft Fabric dashboard automating business workflows from real-time analytics.

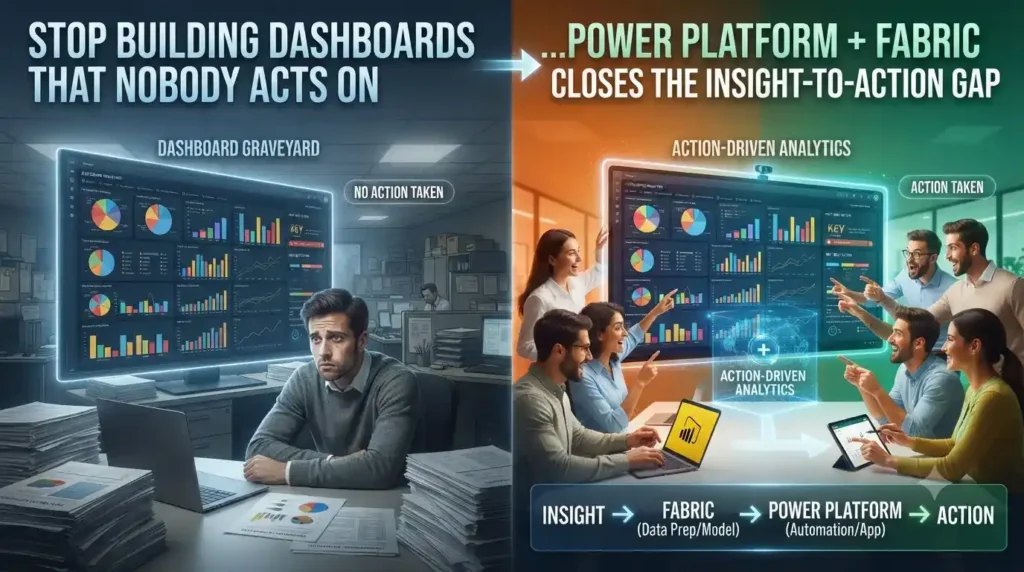
Stop Building Dashboards That Nobody Acts On: Power Platform + Fabric Closes the Insight-to-Action Gap

Your organisation is not short of data. It is short of action. Dashboards get built. Reports get published. KPIs get tracked. And then — nothing changes. The same problems show up in next month’s review. The same questions get asked. The same decisions get delayed. This is the insight-to-action gap. And in 2026, it is the single biggest reason analytics investments fail to deliver business value. The good news: Microsoft Power Platform combined with Microsoft Fabric was purpose-built to close it. Why Most Dashboards Fail to Drive Action Here is an uncomfortable truth that most BI teams already know: building a beautiful dashboard is not the same as solving a business problem. The traditional analytics model works like this — data teams collect data, engineers build pipelines, analysts create reports, and dashboards get shared with decision-makers who read them, nod, and move on. The insight sits in a chart. The action never happens. In today’s landscape, organisations can no longer treat business intelligence as a standalone function. The conversation has fundamentally shifted from “What reports do we need?” to “How do we turn data into decisions — automatically, in real time?” Microsoft recognised this gap and built the answer: a unified platform where data, analytics, and automated action live together. That platform is Microsoft Fabric, powered by the Microsoft Power Platform. What Is the Insight-to-Action Gap? The insight-to-action gap is the distance between seeing something important in your data and actually doing something about it. It sounds simple to close. In practice, it rarely is. Here is why: Data lives in silos. Sales data is in one system. Finance in another. Operations in a third. By the time anyone reconciles them into a single report, the moment to act has passed. Dashboards are passive. A Power BI chart showing a revenue dip is useful. But it does not send an alert, trigger a workflow, or notify the right person automatically. It just sits there waiting for someone to notice. Action requires humans in the loop. When a metric crosses a threshold, someone needs to see it, interpret it, decide what to do, and manually execute a response. Every handoff introduces delay and the risk of inaction. This is exactly the problem that Power Platform and Microsoft Fabric solve — together. How Power Platform + Microsoft Fabric Closes the Gap Microsoft Fabric: One Platform, One Source of Truth Microsoft Fabric is Microsoft’s unified, end-to-end data and analytics platform. It brings data engineering, data warehousing, real-time analytics, data science, and Power BI together into a single experience — built on OneLake, a single data lake that spans your entire organisation. In 2026, Microsoft Fabric is the fastest growing advanced analytics certification in Microsoft history, with over 30,000 organisations now running Fabric in production. Microsoft has been positioned as a Leader in the Gartner Magic Quadrant for Analytics and BI Platforms for eighteen consecutive years — and Fabric is the platform cementing that position for the AI era. What Fabric does is eliminate the data silos that make dashboards passive. When all your data — from ERP, CRM, finance, operations, and supply chain — flows into OneLake automatically, every dashboard, every report, and every automated workflow draws from the same real-time, governed source of truth. No more reconciliation. No more stale data. No more “which number is correct?” Power Platform: Turning Insight Into Instant Action Where Fabric unifies your data, the Microsoft Power Platform turns it into action — automatically. Power Automate monitors your data in real time and triggers workflows the moment a condition is met. A sales order drops below margin threshold — an alert fires to the sales manager instantly. A supplier invoice is flagged as anomalous — an approval workflow launches automatically. Stock falls below minimum level — a purchase order is raised without human intervention. Power Apps puts the action directly into the hands of the people who need it. Instead of a dashboard that a manager reads on a laptop, a Power App surfaces the exact insight a field technician, warehouse supervisor, or store manager needs — on their phone, in the moment, with a button to act on it. Data Activator, Microsoft Fabric’s built-in trigger engine, monitors data continuously and fires alerts or Power Automate flows the moment predefined thresholds are crossed — without anyone needing to check a dashboard at all. Microsoft’s own announcement at Build 2026 called this the next frontier: translytical task flows that blend transactional and analytical systems, allowing users to act on insights directly from dashboards and streamlining decision-to-action cycles. The gap between seeing and doing is closing — and closing fast. What This Looks Like in Practice Retail: Power BI flags a stock anomaly in a specific store. Data Activator triggers a Power Automate flow that notifies the regional manager and raises a transfer order — all before the store opens. Finance: Fabric detects a budget variance above 10%. Power Automate routes it for approval, notifies the CFO, and logs the exception — without anyone running a report. Manufacturing: A production yield drops below target mid-shift. A Power App on the floor supervisor’s phone shows the deviation with a one-tap escalation button — no email chain, no delay. Logistics: A delivery SLA is at risk based on real-time tracking data. An automated alert fires to the account manager and a contingency workflow launches — while the shipment is still in transit. The 2026 Shift: From Reporting to Acting Microsoft Fabric IQ, now generally available, represents the next step — natural language data exploration where business users ask questions in plain English and get instant answers from their data, without writing a query or opening a dashboard. Combined with Copilot in Power BI, which can now generate DAX calculations, summarise reports, and build visuals through natural language — the barrier between data and decision has never been lower. Organisations that adopt Power Platform and Fabric together are not just getting better dashboards. They are building intelligence infrastructure — where every


Stop Building Dashboards That Nobody Acts On: Power Platform + Fabric Closes the Insight-to-Action Gap Read More »

Microsoft BI Tools

Use Business Intelligence and Boost ROI up to 60% in Your Grocery Store!

Grocery stores are facing unpredictability more than ever. With technological advancements, customers too tend to change their preferences faster now. It is time to embrace Business Intelligence Tools driven by Artificial Intelligence. Industry leaders like the Al Dhafra Society use Microsoft BI Tools to identify trends and spot changes in patterns. They modify and innovate strategies based on the insights they receive.   AI is not limited to large-scale industries but small to mid-size businesses as well. Not just groceries, it helps all retail, hospitality, and manufacturing segments of every size to utilize market and business insights and form more logical strategies.  Microsoft BI Tools are a must-have for all decision-makers, as AI is an extremely fast-growing technology combined with Machine Learning (ML), Natural Language Processing, and predictive analysis. You can accurately predict market demands and order just the items in your grocery stores. With a deeper understanding of your customers, you can create relevant strategies, deals, and offers for them at the right time. With this technology, you can even segment customers into groups or categories, as per their needs.   With all this in mind, our team of researchers has found top ways to use Microsoft BI Tools to grow your retail sales.   Collect the Information that Counts  From the plethora of data, you have to find the data that counts. If you are still hung up on the traditional methods of collecting and analyzing data on an excel sheet, you will fall way back in the competition. As your business grows, Excel starts becoming even more irrelevant to your business. You can instead use Business Intelligence Platform, such as Microsoft Power BI Dashboards and Reports.  Microsoft Power BI removes the data storage burden and presents accurate data insights in user-friendly dashboards. You can even view these details in real time and make quicker and more informed decisions.   Figure Out the Gaps the In the Market Trends   It is easy to find out popular market trends. You can collect data about them from your sales history and customer feedback. Moreover, there are other sources through which you can find popular trends in the market. However, have you ever thought about hidden trends? Have you ever tried to find out the gaps in the market? But where to start? That’s the beauty of Microsoft BI Tools; even if you have the data scattered, you can still get the most relevant and useful data for your business.   Moreover, with the combination of natural language processing, and machine learning, AI can sift through the multiple verses of unstructured data including social media to figure out trends before even the customer recognizes them. What else do you need to push back everyone else in the market?   “Un-Complexify” and Automate with Business Intelligence Tools   It is a well-known fact that well-considered and targeted labeling, tags, and description. Tags are responsible for enhancing your item’s chances of being discovered on search engines like Bing and Google. However, generating SEO-friendly descriptions for each of your products consumes time and demands high expertise.   This is where AI-powered product labeling and tagging help. Many grocery retailers are now using computer vision algorithms to find the product’s key attributes and tag them. You can even use these algorithms to generate SEO-friendly titles and spot-on product details to ensure your customers find what they want.   Help Customers Find What They Want  Having delivered the wrong items causes the most returns. But the good news is that grocery retailers can also take proactive measures to improve the quality of their services. For instance, they can write the guidelines and product descriptions more clearly.  With Microsoft BI Tools, retailers can help customers find exactly what they want according to their individual preferences. According to the digital pioneer Asos, customers do not have to browse through thousands of products, instead, they can view the products personally relevant to them.  Understand the Factors Encouraging Your Customers Purchasing a Product    Have you ever wondered why buyers abandon their carts? Did they find better deals somewhere else? Or are they taken aback by the unexpected additional costs? Are they really ready to buy your products? Or is the reason something else? A research firm Baymard Institute found about 70% of buyers lead their carts filled. After estimating they found it costs billions of dollars to store.  With Microsoft Power BI Tools, you can collect masses of data about your customer purchase history, browsing habits, and purchase habits. Find out what is preventing them from placing an order.   As businesses grow, their data burden increases simultaneously. To manage the masses of data, it is smartest to use Power BI Tools such as Microsoft BI Tools. The best part is that they will never burn a hole in your pocket and are easy to use. If you want to know how powerfully it can impact your grocery store individually, you can contact us. We are Microsoft Dynamics Gold Implementation Partner and LS Central Diamond Partner.  

Use Business Intelligence and Boost ROI up to 60% in Your Grocery Store! Read More »

Business intelligence dashboard displaying real-time analytics, KPIs, and organizational insights.

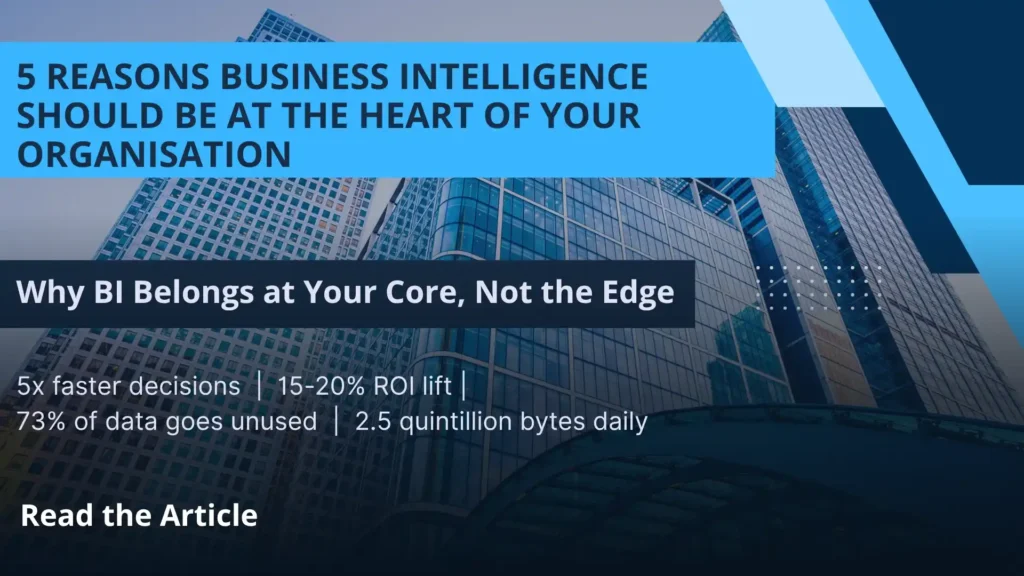
5 Reasons Business Intelligence Should Be at the Heart of Your Organisation

Here is a question worth sitting with: how many decisions does your business make every week based on gut instinct rather than real data? For most organisations, the honest answer is — more than it should. Not because the data does not exist. It does. It sits in spreadsheets, CRM systems, ERP platforms, and finance tools across your organisation. The problem is that it is scattered, siloed, and impossible to see clearly as a whole picture. Business intelligence (BI) is what changes that. It connects your data, organises it into meaningful insights, and puts the right information in front of the right person at exactly the right moment. Here are five compelling reasons why BI should be at the heart of every modern organisation — and why 2025 is the year to make it a strategic priority. What Is Business Intelligence and Why Does It Matter Now? Business intelligence is the technology, processes, and tools that transform raw organisational data into clear, actionable insights. It covers everything from interactive dashboards and real-time reports to advanced analytics and predictive modelling. In today’s digital-first environment, business leaders face a paradox — they have more data than ever before, yet feel less certain about the decisions they are making. BI resolves that paradox. It turns data overload into decision-making clarity. 5 Reasons Every Organisation Needs a BI Strategy 1. Make Smarter, Faster Business Decisions Data is not the same as intelligence. A business manager can be surrounded by reports and spreadsheets and still have no clear picture of what is actually happening — because the data is fragmented, delayed, and inconsistent across systems. BI changes this fundamentally. It creates a single, unified source of truth — pulling data from every corner of your organisation into one place and presenting it clearly through real-time dashboards. Instead of waiting for someone to compile a weekly report, you see exactly where your business stands right now. The result is better decisions, made faster, with genuine confidence behind them. 2. Supercharge Sales and Marketing Performance Sales and marketing teams are most effective when they work from the same data — and when that data tells them exactly where the opportunities are. For sales teams, BI identifies trends in customer behaviour, highlights the accounts most likely to convert, surfaces upsell and cross-sell opportunities, and quantifies pipeline performance in real time. No more guesswork about where to focus time and effort. For marketing, BI makes campaign performance immediately visible — showing which channels, messages, and audiences are delivering results, and which are wasting budget. Teams can adjust campaigns mid-flight based on real evidence rather than waiting for a post-campaign review. When both teams work from the same BI platform, the alignment between sales and marketing improves dramatically — and so do the revenue results. 3. Eliminate Inefficiencies and Boost Productivity Every organisation has processes that consume more time and resources than they should. The challenge is that inefficiencies are often invisible — buried in the day-to-day routine and never questioned because “that is how we have always done it.” BI makes inefficiencies visible. It identifies bottlenecks in production workflows, reveals where time is being lost in sales cycles, highlights which processes are underperforming against targets, and automates the routine reporting tasks that consume hours of management time every week. The productivity gains from a well-implemented BI strategy are felt across every department — from customer service and operations to finance and product development. 4. Improve Data Quality and Accuracy Across the Business When data lives in separate systems — a CRM here, an ERP there, a spreadsheet somewhere else — inconsistencies multiply silently. The same customer appears in three systems with three different records. Sales figures differ between the finance report and the sales report. Nobody is sure which number to trust. This is not just an inconvenience. Poor data quality leads to wasted marketing spend, missed sales opportunities, flawed forecasts, and brand damage from miscommunication with customers. BI addresses this at the root. By centralising data and creating a single validated source of truth, it surfaces inconsistencies and gaps that would otherwise remain hidden — improving the accuracy and reliability of every business decision that depends on data. 5. Deliver a Measurable, Business-Wide ROI Every investment decision your organisation makes should have a measurable return — and BI investment is no different. The good news is that the ROI from a well-implemented BI strategy tends to be both significant and multi-dimensional. Better decisions lead to more revenue. Eliminated inefficiencies reduce costs. Improved data quality reduces waste. Smarter sales and marketing generates higher conversion rates. Together, these improvements compound — creating a measurable uplift in business performance that justifies the investment many times over. Organisations that treat BI as a strategic priority consistently outperform those that do not — not because they have access to different data, but because they use their data more intelligently. What Business Intelligence Looks Like in Practice The best BI implementations are not complex IT projects. They are practical, accessible tools that become part of how people work every day. A sales director starts each morning with a dashboard showing pipeline health, conversion rates, and this week’s revenue forecast — updated overnight from live system data. A marketing manager checks campaign ROI in real time — adjusting spend toward channels that are converting and pulling back from those that are not. A CEO reviews a single consolidated view of company-wide performance — financial, operational, and customer — in one place, in minutes rather than hours. This is what BI enables. And with modern cloud-based platforms, this level of insight is accessible to organisations of every size. How Microsoft Power BI Delivers All 5 Benefits Microsoft Power BI is one of the world’s most widely adopted business intelligence platforms — and for good reason. It connects natively to Microsoft Dynamics 365, Azure, Excel, SQL databases, and hundreds of third-party data sources — bringing all your organisational data into one unified analytics environment. Interactive dashboards

5 Reasons Business Intelligence Should Be at the Heart of Your Organisation Read More »