Welcome to Trident Information Systems!
Write us to - info@tridentinfo.com
Let's Socialize

Microsoft Power Bi

Microsoft Power Platform and Microsoft Fabric dashboard automating business workflows from real-time analytics.

Stop Building Dashboards That Nobody Acts On: Power Platform + Fabric Closes the Insight-to-Action Gap

Your organisation is not short of data. It is short of action. Dashboards get built. Reports get published. KPIs get tracked. And then — nothing changes. The same problems show up in next month’s review. The same questions get asked. The same decisions get delayed. This is the insight-to-action gap. And in 2026, it is the single biggest reason analytics investments fail to deliver business value. The good news: Microsoft Power Platform combined with Microsoft Fabric was purpose-built to close it. Why Most Dashboards Fail to Drive Action Here is an uncomfortable truth that most BI teams already know: building a beautiful dashboard is not the same as solving a business problem. The traditional analytics model works like this — data teams collect data, engineers build pipelines, analysts create reports, and dashboards get shared with decision-makers who read them, nod, and move on. The insight sits in a chart. The action never happens. In today’s landscape, organisations can no longer treat business intelligence as a standalone function. The conversation has fundamentally shifted from “What reports do we need?” to “How do we turn data into decisions — automatically, in real time?” Microsoft recognised this gap and built the answer: a unified platform where data, analytics, and automated action live together. That platform is Microsoft Fabric, powered by the Microsoft Power Platform. What Is the Insight-to-Action Gap? The insight-to-action gap is the distance between seeing something important in your data and actually doing something about it. It sounds simple to close. In practice, it rarely is. Here is why: Data lives in silos. Sales data is in one system. Finance in another. Operations in a third. By the time anyone reconciles them into a single report, the moment to act has passed. Dashboards are passive. A Power BI chart showing a revenue dip is useful. But it does not send an alert, trigger a workflow, or notify the right person automatically. It just sits there waiting for someone to notice. Action requires humans in the loop. When a metric crosses a threshold, someone needs to see it, interpret it, decide what to do, and manually execute a response. Every handoff introduces delay and the risk of inaction. This is exactly the problem that Power Platform and Microsoft Fabric solve — together. How Power Platform + Microsoft Fabric Closes the Gap Microsoft Fabric: One Platform, One Source of Truth Microsoft Fabric is Microsoft’s unified, end-to-end data and analytics platform. It brings data engineering, data warehousing, real-time analytics, data science, and Power BI together into a single experience — built on OneLake, a single data lake that spans your entire organisation. In 2026, Microsoft Fabric is the fastest growing advanced analytics certification in Microsoft history, with over 30,000 organisations now running Fabric in production. Microsoft has been positioned as a Leader in the Gartner Magic Quadrant for Analytics and BI Platforms for eighteen consecutive years — and Fabric is the platform cementing that position for the AI era. What Fabric does is eliminate the data silos that make dashboards passive. When all your data — from ERP, CRM, finance, operations, and supply chain — flows into OneLake automatically, every dashboard, every report, and every automated workflow draws from the same real-time, governed source of truth. No more reconciliation. No more stale data. No more “which number is correct?” Power Platform: Turning Insight Into Instant Action Where Fabric unifies your data, the Microsoft Power Platform turns it into action — automatically. Power Automate monitors your data in real time and triggers workflows the moment a condition is met. A sales order drops below margin threshold — an alert fires to the sales manager instantly. A supplier invoice is flagged as anomalous — an approval workflow launches automatically. Stock falls below minimum level — a purchase order is raised without human intervention. Power Apps puts the action directly into the hands of the people who need it. Instead of a dashboard that a manager reads on a laptop, a Power App surfaces the exact insight a field technician, warehouse supervisor, or store manager needs — on their phone, in the moment, with a button to act on it. Data Activator, Microsoft Fabric’s built-in trigger engine, monitors data continuously and fires alerts or Power Automate flows the moment predefined thresholds are crossed — without anyone needing to check a dashboard at all. Microsoft’s own announcement at Build 2026 called this the next frontier: translytical task flows that blend transactional and analytical systems, allowing users to act on insights directly from dashboards and streamlining decision-to-action cycles. The gap between seeing and doing is closing — and closing fast. What This Looks Like in Practice Retail: Power BI flags a stock anomaly in a specific store. Data Activator triggers a Power Automate flow that notifies the regional manager and raises a transfer order — all before the store opens. Finance: Fabric detects a budget variance above 10%. Power Automate routes it for approval, notifies the CFO, and logs the exception — without anyone running a report. Manufacturing: A production yield drops below target mid-shift. A Power App on the floor supervisor’s phone shows the deviation with a one-tap escalation button — no email chain, no delay. Logistics: A delivery SLA is at risk based on real-time tracking data. An automated alert fires to the account manager and a contingency workflow launches — while the shipment is still in transit. The 2026 Shift: From Reporting to Acting Microsoft Fabric IQ, now generally available, represents the next step — natural language data exploration where business users ask questions in plain English and get instant answers from their data, without writing a query or opening a dashboard. Combined with Copilot in Power BI, which can now generate DAX calculations, summarise reports, and build visuals through natural language — the barrier between data and decision has never been lower. Organisations that adopt Power Platform and Fabric together are not just getting better dashboards. They are building intelligence infrastructure — where every

Stop Building Dashboards That Nobody Acts On: Power Platform + Fabric Closes the Insight-to-Action Gap Read More »

Power BI pharmacy dashboard displaying profit margins, dead stock, expiry losses, top loss-making drugs, and branch performance.

Power BI Pharmacy Dashboards: See Your Top 10 Money-Losing Drugs in Real-Time

Every pharmacy has drugs that are silently draining profit. The problem is most owners don’t know which ones — until it’s too late. A medicine sitting on the shelf past its expiry date. A high-cost drug with razor-thin margins being sold without discount controls. A slow-moving SKU tying up valuable shelf space and working capital month after month. These are not exceptional situations. They happen every day in pharmacies that are running without real-time data visibility. Power BI pharmacy dashboards change that completely. They give pharmacy owners, chain managers, and finance teams a live, visual window into exactly which drugs are costing you money — and why. The Problem With How Most Pharmacies Track Drug Performance Most pharmacies still rely on monthly reports, weekly stock counts, and end-of-day billing summaries to understand their business performance. By the time the data reaches a decision-maker, it is days or weeks old. The slow-moving stock has already aged further. The margin-eroding drug has already been sold at a loss hundreds of times. The pharmaceutical industry is seeing an enormous shift toward real-time analytics. 69% of commercial pharmacy teams are actively increasing their spending on data analytics solutions, and more than 85% of pharma executives plan to increase investment in data and digital tools through 2026. The reason is simple: pharmacies that see their data in real time make better decisions, faster. Power BI is the tool making this possible for pharmacies of every size. What Is a Power BI Pharmacy Dashboard? Microsoft Power BI is a business intelligence platform that connects to your pharmacy management system, ERP, or billing software and transforms raw transaction data into live, interactive visual dashboards. For pharmacies specifically, a Power BI dashboard pulls data from your point-of-sale system, inventory records, purchase orders, and financial reports — and presents it in a single screen that updates automatically, in real time. No manual reports. No spreadsheet exports. No waiting until month-end to find out where your money went. Seeing Your Top 10 Money-Losing Drugs in Real Time This is where Power BI delivers its most immediate and powerful value for pharmacy owners. A well-built Power BI pharmacy dashboard can show you — right now, today — a ranked list of your top 10 money-losing drugs based on multiple profitability factors: Margin loss — drugs being sold below or too close to cost price due to pricing errors, discount overrides, or supplier price changes not reflected in your selling price. Dead stock value — medicines that have not moved in 30, 60, or 90 days, with the total capital value tied up in each. A visual ranking of these by rupee value makes the cost of inaction immediately visible. Expiry loss forecast — drugs whose current stock will expire before projected consumption. The dashboard flags these before the loss occurs — not after. High-return rate drugs — medicines being returned at higher-than-average rates, signalling quality, storage, or dispensing issues that are quietly eroding revenue. Purchase price vs selling price variance — automatic alerts when your supplier raises a drug’s cost price but your selling price hasn’t been updated, creating an invisible margin gap on every sale. One pharma analytics implementation reported a 40% reduction in reporting cycle time and a significant improvement in revenue tracking accuracy after deploying Power BI dashboards. For a pharmacy chain, that kind of visibility translates directly into faster decisions and recovered margin. Key Metrics Your Power BI Pharmacy Dashboard Should Track Beyond the top 10 money-losing drugs, a comprehensive Power BI pharmacy dashboard gives you live visibility across: Sales Performance Inventory Intelligence Margin and Profitability Supplier and Purchase Analytics Branch and Multi-Location Performance Why Power BI Works So Well for Pharmacy Analytics The reason Power BI has become the go-to analytics platform for pharmacies — particularly those running on Microsoft Dynamics 365 or similar ERP systems — comes down to three things. Seamless integration. Power BI connects directly to your pharmacy management system, ERP, billing software, SQL databases, and even Excel files — with no manual data export required. Data flows in automatically and dashboards update in real time. No IT team required. As of 2026, Power BI’s Copilot feature allows pharmacy managers to query their own data using natural language — asking questions like “which drugs had the lowest margin last month” and getting an instant visual answer without writing a single formula. Affordable at every scale. Power BI starts at approximately $14 per user per month — making enterprise-grade pharmacy analytics accessible to independent pharmacies, not just large chains. The Competitive Advantage of Real-Time Pharmacy Analytics Pharmacies operating with real-time Power BI dashboards are making decisions that their competitors simply cannot make — because their competitors don’t have the data. They catch margin erosion before it compounds. They clear dead stock before it expires. They identify their money-losing drugs in real time and take corrective action within hours — not weeks. In an industry where margins are already thin and competition is intense, that visibility is not a luxury. It is the difference between a profitable pharmacy and one that is slowly losing money without knowing why. Power BI doesn’t just show you your top 10 money-losing drugs. It gives you the power to stop losing money on them — starting today. Trident Information Systems integrates Microsoft Power BI with Dynamics 365-based pharmacy management solutions, giving pharmacy chains real-time profitability dashboards configured for your specific business. Talk to our experts at tridentinfo.com/contact.

Power BI Pharmacy Dashboards: See Your Top 10 Money-Losing Drugs in Real-Time Read More »

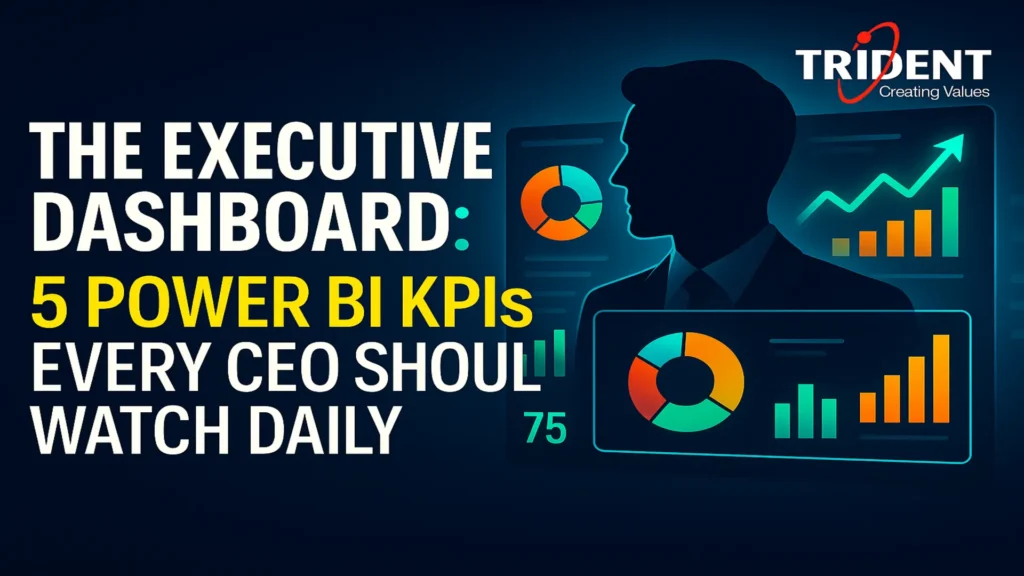
CEO-focused Power BI dashboard displaying real-time business performance metrics.

The Executive Dashboard: 5 Power BI KPIs Every CEO Should Watch Daily

In an era where decisions are made at the speed of data, executive dashboards have become the command center for modern leadership. We believe that Power BI dashboards are no longer optional tools—they are strategic assets that translate complex data into decisive action. For CEOs, the challenge is not access to data, but clarity. The right Key Performance Indicators (KPIs), visualized effectively through Microsoft Power BI, can illuminate risks, uncover opportunities, and keep organizations aligned with strategic goals—daily. This article outlines the five essential Power BI KPIs every CEO should monitor daily, explains how they drive executive decision-making, and demonstrates how Power BI consulting services, Power BI development, and business intelligence services can transform raw data into a competitive advantage. Why CEOs Need an Executive Dashboard Built in Power BI An executive dashboard is not a collection of charts—it is a strategic narrative. We design Power BI executive dashboards to answer one question: Are we winning today? CEOs operate at the intersection of vision and execution, and they need instant visibility into performance without digging through reports. Power BI stands out as the platform of choice because it integrates seamlessly with ERP systems, CRM platforms, cloud databases, and third-party applications. With real-time data refresh, AI-powered insights, and enterprise-grade security, Power BI delivers a single source of truth across the organization. From a leadership perspective, a well-designed dashboard offers: Our experience as a Power BI service provider shows that CEOs who rely on daily dashboards lead with confidence, precision, and agility. KPI #1: Revenue Performance and Growth Rate Revenue is the lifeblood of every organization, and it deserves top placement on the executive dashboard. We recommend tracking total revenue, month-over-month growth, year-over-year growth, and revenue by segment through interactive Power BI reports. A CEO should be able to answer, at a glance: Using Power BI data modeling and DAX calculations, we build revenue dashboards that highlight trends, anomalies, and forecasts. Visual elements such as KPI cards, trend lines, and waterfall charts allow executives to move from overview to insight in seconds. For service providers and consultants, this KPI also supports predictive analytics, enabling leadership to anticipate revenue gaps before they materialize. Revenue dashboards are not about hindsight—they are about foresight. KPI #2: Operating Profit Margin Revenue without profitability is noise. That is why operating profit margin is a non-negotiable KPI for CEOs. This metric reveals how efficiently the organization converts revenue into profit after operational costs. Through Power BI financial dashboards, we track: What makes Power BI uniquely powerful is its ability to blend financial and operational data. CEOs can drill down from a high-level margin view into specific cost centers, departments, or processes impacting profitability. We often implement row-level security (RLS) and custom Power BI visuals to ensure sensitive financial data is accessible only to authorized executives. The result is a secure, transparent, and actionable profitability dashboard that supports strategic cost control and margin optimization. KPI #3: Cash Flow and Liquidity Position Profitability does not guarantee liquidity. CEOs must monitor cash flow daily to ensure the organization can meet its obligations, fund growth, and withstand volatility. A Power BI cash flow dashboard provides real-time visibility into financial resilience. Key metrics include: By integrating Power BI with accounting systems and banking data, we deliver real-time cash flow analytics that replace static spreadsheets. CEOs can identify bottlenecks in collections, assess payment risks, and optimize working capital. For organizations offering Power BI implementation services, this KPI is often a turning point—transforming finance teams from reactive reporters into proactive advisors. KPI #4: Customer Health and Retention Rate Customers are not just revenue sources; they are long-term assets. CEOs need a clear view of customer retention, churn rate, and lifetime value to ensure sustainable growth. Power BI enables a holistic view of customer health by combining sales, support, and engagement data. A customer-focused executive dashboard tracks: With Power BI analytics, CEOs can see which customer segments are at risk and which drive long-term value. Interactive slicers allow leadership to analyze customer health by region, product, or account manager. From a strategic standpoint, this KPI supports data-driven decisions around pricing, product development, and customer experience investments—areas that directly influence competitive positioning. KPI #5: Workforce Productivity and Utilization People power performance. CEOs must understand how effectively their workforce converts effort into outcomes. A Power BI HR dashboard provides insights into productivity, utilization, and workforce trends without micromanagement. Critical workforce KPIs include: By integrating Power BI with HR systems, project management tools, and time-tracking platforms, we create dashboards that reveal productivity patterns across teams and departments. CEOs gain clarity on capacity constraints, skill gaps, and organizational efficiency. This KPI is especially valuable for professional services firms and IT consultancies, where utilization directly impacts profitability. With Power BI, workforce analytics become a strategic lever rather than an administrative burden. Designing the Ideal Power BI Executive Dashboard An executive dashboard must be intuitive, fast, and focused. We design Power BI dashboards for CEOs using best practices that prioritize clarity over complexity: We leverage Power BI service, Power BI Pro, and Power BI Premium to ensure scalability and performance. Advanced features such as AI insights, natural language queries, and automated alerts further enhance executive decision-making. As a Power BI consulting partner, we tailor each dashboard to leadership priorities, ensuring alignment with organizational strategy. Why Partner with a Power BI Service Provider Building an executive dashboard requires more than technical skills—it demands business acumen. As a Power BI development and consulting service provider, we bridge the gap between data and decisions. Our Power BI services include: Whether delivered as an individual consultant or a full-service BI partner, our goal is to empower CEOs with dashboards that drive clarity, confidence, and control. Conclusion: Leading with Insight, Not Instinct The modern CEO does not guess—they know. By monitoring the five essential Power BI KPIs—revenue growth, operating margin, cash flow, customer health, and workforce productivity—leaders gain a real-time pulse on organizational performance. An executive dashboard built in Power BI transforms data into a strategic

The Executive Dashboard: 5 Power BI KPIs Every CEO Should Watch Daily Read More »

Business dashboard visualizing data insights using Microsoft Power BI for strategic decision-making and growth

How Microsoft Power BI Consulting & Development Solutions Can Transform Your Business

Introduction Ever felt like your business is sitting on a mountain of data but still making decisions in the dark? You’re not alone. In today’s digital age, data is everywhere — but turning that data into actionable insights? That’s where the magic of Microsoft Power BI happens. Enter Microsoft Power BI — a powerful, intuitive, and scalable business intelligence platform that can completely transform how you understand, analyze, and act on your data. Whether you’re a startup or an enterprise, Microsoft Power BI consulting and development services can help you tap into this potential with precision. Understanding Microsoft Power BI What Does Power BI Do? At its core, Microsoft Power BI is a suite of tools that turns raw data into rich visuals and interactive dashboards. It helps you understand what’s happening in your business and why. Key Components of Power BI Data Visualization Made Easy Even if you’re not a data geek, Microsoft Power BI makes complex data digestible. Bar charts, KPIs, scatter plots, maps — you name it. The platform is designed to be user-friendly, yet powerful under the hood. The Role of Power BI Consulting What Power BI Consultants Actually Do A Power BI consultant isn’t just a report-builder. They analyze your business goals, data sources, and user needs to design a solution that delivers insight — not just information. Benefits of Hiring a Power BI Consultant Power BI Development Services Explained Custom Dashboards & Reports Need a dashboard to track regional sales performance or inventory turnover? Developers can create exactly what you need — with automation and drill-down capabilities built-in. Integration With Existing Systems Power BI can seamlessly connect to: Data Modeling & Transformation Before data can be visualized, it must be cleaned, structured, and made usable. Developers use Power Query and DAX to make your messy data work for you. Transforming Raw Data Into Smart Decisions From Chaos to Clarity Imagine turning your spreadsheets, CRM entries, and emails into one cohesive view. That’s what Power BI does — unify your data into something actually usable. Predictive Analytics and Forecasting Why guess what will happen next quarter when Power BI can show you? By integrating AI and machine learning, Power BI helps forecast trends and outcomes with confidence. Real-Time Data Access and Insights Why Real-Time Data Matters Static reports are old news. With Power BI, you get live dashboards that update as your data changes — helping you make timely decisions that matter. Dashboards That Talk Back Power BI dashboards aren’t just pretty pictures. You can filter, drill down, and interact with the visuals to uncover hidden insights. Better Collaboration Through Power BI Interactive Dashboards for Teams Tired of sending reports back and forth over email? With Power BI, your whole team sees the same version — always up-to-date. Power BI + Microsoft Teams When combined with Teams, your dashboards live where your collaboration happens. One click, and everyone’s on the same page. Scalability and Flexibility for Growing Businesses Start Small, Scale Fast Power BI works whether you have 100 records or 10 million. You can start with a small dashboard and scale as your needs grow. Tailoring Power BI to Your Business Needs With custom development, your Power BI solution fits like a glove. Custom visuals, connectors, and DAX formulas ensure you get exactly what you need. Security and Compliance Enterprise-Grade Security Worried about data breaches? Don’t be. Power BI follows Microsoft’s strict security protocols, including encryption and authentication. Role-Based Access and GDPR Compliance Control who sees what — from executives to interns. Plus, Power BI helps ensure compliance with global data laws like GDPR. Common Business Use Cases Sales & Marketing Performance Track your funnel, conversions, ad spend, and ROI — all from a single view. Financial Planning & Budgeting From P&L statements to cash flow projections, Power BI makes finance smarter. Operations & Supply Chain Analytics Monitor logistics, delivery times, and inventory levels — in real-time. Industry-Specific Applications Power BI for Healthcare Track patient metrics, reduce wait times, and improve resource planning. Power BI for Retail and eCommerce Understand customer behavior, optimize stock levels, and forecast trends. Power BI for Manufacturing Monitor equipment efficiency, reduce downtime, and boost productivity. Choosing the Right Power BI Partner What to Look For Questions to Ask Before Signing a Contract ROI of Power BI Implementation Tangible and Intangible Benefits Cost vs. Long-Term Value Yes, there’s an upfront cost — but the long-term savings and growth? Game-changing. Future of Business Intelligence With Power BI AI and Machine Learning Integration Microsoft is infusing Power BI with more AI every day — expect smarter dashboards and automated insights soon. What to Expect in the Next 5 Years Conclusion If you’re still relying on spreadsheets and gut instinct, it’s time for an upgrade. Microsoft Power BI — when paired with the right consulting and development team — can truly revolutionize how your business operates. It doesn’t matter whether you’re in retail, healthcare, finance, or manufacturing — Power BI makes data work for you, not the other way around. Lastly, if you are looking for a expert Implementation Partner ? you may as well contact Trident Information Systems. We are the Top Dynamics 365 Partners Being Gold D365 Implementation Partner and LS Retail Diamond Partner, we have a massive team of dedicated professionals. Our team is looking forward to serving your business and helping you grow. Contact Us for further information. For more insightful content and industry updates, follow our LinkedIn page. FAQs 1. What’s the difference between Power BI consulting and development? Consulting focuses on strategy and planning, while development involves building reports, dashboards, and custom solutions. 2. Can Power BI integrate with my existing ERP system? Yes! Power BI integrates with most modern ERP systems like Microsoft Dynamics 365, SAP, and Oracle. 3. Is Power BI suitable for small businesses? Absolutely. It’s scalable and affordable, making it a great fit for businesses of all sizes. 4. How long does it take to implement Power BI? It depends on your needs — simple setups take days; complex enterprise implementations may take

How Microsoft Power BI Consulting & Development Solutions Can Transform Your Business Read More »

A team of expert Power BI consultants analyzing data insights for business growth.

Top Reasons to Hire Our Power BI Consultants for Data-Driven Growth

Introduction In today’s fast-paced digital world, businesses rely on data to drive decisions and stay ahead of the competition. But raw data alone isn’t enough. To truly leverage its potential, you need a robust business intelligence tool like Microsoft Power BI. However, navigating Power BI’s capabilities requires expertise. That’s where our Power BI consultants come in. What is Power BI? Power BI is a powerful business analytics tool by Microsoft that enables organizations to visualize their data, generate insights, and make data-driven decisions. It offers interactive dashboards, real-time reporting, AI-powered analytics, and seamless data integration, making it a go-to solution for enterprises of all sizes. Why Your Business Needs Power BI Consultants Implementing Power BI effectively requires in-depth knowledge of data modeling, integration, and visualization techniques. Many businesses struggle with complex datasets, inefficient reporting, and data inaccuracies. Our consultants bridge this gap, ensuring smooth implementation, high performance, and insightful data-driven strategies. Key Benefits of Hiring Our Power BI Consultants Expertise in Data Visualization Our consultants transform raw data into intuitive and interactive dashboards, making complex insights easy to understand. Custom Dashboard Creation Every business has unique data needs. We tailor Power BI dashboards to match specific KPIs and objectives. Seamless Data Integration We integrate Power BI with multiple data sources, including Excel, SQL databases, cloud platforms, and third-party applications. Advanced Analytics and AI-Driven Insights Our consultants leverage AI capabilities to provide predictive analytics, trend analysis, and automation. Performance Optimization We fine-tune your Power BI environment to ensure faster report generation and optimal data processing speeds. Industries That Benefit from Power BI Consulting Power BI is a game-changer across various industries: How Our Power BI Consultants Enhance Your Business We help businesses transition from intuition-based decisions to data-backed strategies, improving efficiency and profitability. Our Power BI solutions reduce manual reporting, enhance forecasting accuracy, and lower operational costs. Custom Power BI Solutions for Your Business We provide tailor-made Power BI solutions that ensure: Steps to Hiring Our Power BI Consultants Common Challenges and How We Overcome Them Cost vs. ROI: Why Investing in Power BI Consulting Makes Sense While hiring a Power BI consultant may seem like an expense, the long-term benefits far outweigh the costs. Improved efficiency, better insights, and reduced errors lead to substantial ROI. Why Choose Our Power BI Consultants? Lastly, if you are looking for a expert Implementation Partner ? you may as well contact Trident Information Systems. We are the Top Dynamics 365 Partners Being Gold D365 Implementation Partner and LS Retail Diamond Partner, we have a massive team of dedicated professionals. Our team is looking forward to serving your business and helping you grow. Contact Us for further information. For more insightful content and industry updates, follow our LinkedIn page. FAQs

Top Reasons to Hire Our Power BI Consultants for Data-Driven Growth Read More »

12 benefits of Power BI services

Top 12 Benefits of Power BI Services for Data-Driven Growth

Introduction In today’s digital world, data is the new gold. Businesses that harness data effectively stay ahead of the competition. But raw data alone isn’t enough—you need tools to analyze and visualize it efficiently. That’s where Power BI Services come in. Power BI, developed by Microsoft, is a powerful business intelligence (BI) tool that helps businesses turn raw data into meaningful insights. Whether you’re a small business or a large enterprise, Power BI services can revolutionize how you analyze and utilize data for growth. What is Power BI? Power BI is a business analytics service by Microsoft that enables users to visualize data, generate reports, and make data-driven decisions. It connects multiple data sources, including Excel, cloud services, and databases, to provide real-time insights. Key Features of Power BI: Why Power BI Services Matter for Businesses? The Role of Data in Decision-Making Modern businesses rely heavily on data to make strategic decisions. Without proper tools, data can be overwhelming and underutilized. How Power BI Enhances Data Utilization Power BI organizes and processes complex data sets into understandable reports, enabling faster and more informed decision-making. Top 12 Benefits of Power BI Services 1. Seamless Data Integration Power BI connects with over 100+ data sources, including Microsoft Excel, SQL databases, Google Analytics, Salesforce, and more. This eliminates data silos and ensures all business data is in one place. 2. Real-Time Data Access With Power BI, businesses can access real-time dashboards to monitor KPIs instantly. This means faster response times and more proactive decision-making. 3. Interactive Dashboards & Reports Gone are the days of static reports. Power BI offers highly interactive visualizations, allowing users to drill down into data, filter results, and customize dashboards on the go. 4. AI-Powered Insights Power BI uses artificial intelligence (AI) to identify trends, forecast patterns, and provide smart suggestions—making analytics accessible to everyone, not just data scientists. 5. Improved Decision-Making Accurate and data-backed reports lead to better business decisions. Power BI ensures data consistency, reducing errors in reporting and analysis. 6. Scalability & Flexibility Whether you’re a startup or a Fortune 500 company, Power BI scales effortlessly. It grows with your business, adapting to increasing data needs. 7. Cloud & On-Premise Deployment Power BI offers flexible deployment options, making it suitable for businesses preferring cloud solutions (Power BI Service) or on-premises (Power BI Report Server). 8. Cost-Effective Solution Unlike traditional BI tools, Power BI offers an affordable pricing model, making it a cost-effective choice for businesses of all sizes. 9. Enhanced Data Security With Microsoft’s enterprise-grade security, Power BI ensures data encryption, compliance, and access controls—keeping sensitive business data safe. 10. Customizable Visualizations Power BI supports custom visuals alongside standard charts and graphs, allowing businesses to present data in a way that suits their industry-specific needs. 11. Mobile Accessibility Power BI’s mobile app ensures users can access reports and dashboards on smartphones and tablets, enabling decision-making on the go. 12. Easy Collaboration & Sharing With Power BI’s collaboration features, teams can share reports, embed dashboards in apps, and work together seamlessly in real time. How Power BI Drives Business Growth? Companies leveraging Power BI have experienced faster data analysis, reduced reporting time, and better strategic planning. For example: Getting Started with Power BI Services Steps to Implement Power BI: Best Practices for Maximum ROI Why Choose Trident for Power BI Services & Consulting? Choosing the right partner for Power BI implementation is crucial for maximizing the benefits of data analytics. Trident stands out as a trusted provider of Power BI services and consulting, offering: 1. Expertise in Microsoft Technologies Trident has extensive experience in Microsoft Power BI, Dynamics 365, Azure, and other Microsoft ecosystems, ensuring seamless integration and expert implementation. 2. Tailored Power BI Solutions Every business has unique data needs. Trident provides customized Power BI solutions that align with industry-specific requirements, from retail and manufacturing to finance and healthcare. 3. End-to-End Implementation Support From data integration and dashboard creation to advanced analytics and AI-driven insights, Trident handles the entire Power BI implementation process, ensuring a hassle-free experience. 4. Ongoing Training & Support Trident ensures that businesses get the most out of Power BI by providing hands-on training, workshops, and dedicated support for continuous improvement. 5. Cost-Effective and Scalable Solutions Trident offers affordable Power BI services that cater to businesses of all sizes. Whether you need on-premise, cloud, or hybrid deployment, their solutions are designed to scale as your business grows. 6. Proven Track Record of Success With a portfolio of successful Power BI implementations, Trident has helped organizations unlock the full potential of their data, reducing reporting time, improving efficiency, and driving strategic growth. Partnering with Trident ensures that your business leverages Power BI effectively, transforming raw data into actionable insights for sustainable, data-driven growth. Conclusion Power BI Services transform how businesses interact with data, offering real-time insights, AI-powered analytics, and seamless integration. Whether you’re a small business or a multinational enterprise, adopting Power BI ensures data-driven growth and a competitive edge. Lastly, if you are looking for a expert Implementation Partner ? you may as well contact Trident Information Systems. We are the Top Dynamics 365 Partners Being Gold D365 Implementation Partner and LS Retail Diamond Partner, we have a massive team of dedicated professionals. Our team is looking forward to serving your business and helping you grow. Contact Us for further information. For more insightful content and industry updates, follow our LinkedIn page. FAQs 1. How does Power BI help in business intelligence?Power BI turns raw data into meaningful visual reports, helping businesses make informed decisions quickly. 2. What industries benefit the most from Power BI?Retail, healthcare, finance, manufacturing, and logistics industries benefit significantly from Power BI’s analytics. 3. Is Power BI suitable for small businesses?Yes, Power BI offers scalable solutions suitable for businesses of all sizes, with affordable pricing options. 4. Can Power BI integrate with other Microsoft tools?Yes, it seamlessly integrates with Excel, SharePoint, Dynamics 365, and Azure services. 5. How secure is Power BI for data analytics?Power BI follows Microsoft’s strict security protocols, including encryption, compliance, and role-based access control.

Top 12 Benefits of Power BI Services for Data-Driven Growth Read More »

Microsoft Power BI Consulting & Development Services

Unlock the Full Power of Your Data with Microsoft Power BI Consulting & Development Services

Introduction In the modern business world, data isn’t just information—it’s power. But this power is only useful if you can harness it effectively. That’s where Microsoft Power BI comes in. With its advanced analytics and visualization tools, Power BI helps businesses make sense of their data. Our Microsoft Power BI Consulting & Development Services are designed to help you unlock the full potential of this platform, driving informed decisions and tangible growth. Why Microsoft Power BI? Interactive Dashboards That Transform Data Microsoft Power BI transforms raw data into visually compelling and interactive dashboards. These dashboards make it easy to monitor your business performance and track key metrics at a glance. Instead of sifting through endless rows of spreadsheets, you get insights that are easy to understand and act upon. Seamless Integration with Your Existing Systems Microsoft Power BI connects effortlessly with tools you already use, like Dynamics 365, Excel, Salesforce, and more. This integration allows you to centralize your data for a more cohesive view of your business operations. Whether you’re working with cloud-based or on-premises systems, Power BI ensures a smooth experience. Real-Time Insights for Better Decisions In fast-paced industries, real-time insights can make all the difference. Power BI enables businesses to view live data, ensuring decisions are made based on the most current information. Whether you’re tracking sales performance or monitoring production metrics, real-time analytics keep you ahead of the curve. Key Features of Microsoft Power BI AI-Powered Analytics Power BI leverages artificial intelligence to uncover trends, predict outcomes, and highlight anomalies in your data. This means you don’t just see what happened—you can anticipate what’s coming. It’s like having a crystal ball for your business. Mobile Access for Decision-Making on the Go With Power BI’s mobile app, you’re no longer tied to your desk to make decisions. Access your dashboards and reports anytime, anywhere. This feature is invaluable for leaders who need to stay informed while traveling or attending meetings. Cloud and On-Premises Flexibility Whether you prefer the flexibility of cloud computing or the security of on-premises solutions, Power BI has you covered. It adapts to your infrastructure, ensuring you get the benefits of analytics without compromising your existing systems. Benefits of Microsoft Power BI Consulting Services Tailored Solutions for Your Business Every business is unique, and so are its data needs. Our Power BI consultants take the time to understand your challenges and objectives, creating customized solutions that align with your goals. From specific dashboards to industry-focused analytics, we deliver what matters most to you. Streamlined Data Management Dealing with scattered and unorganized data can be overwhelming. Our consulting services help you consolidate and structure your data, making it easier to analyze and interpret. With better data management, you gain clarity and efficiency across your operations. Enhanced Decision-Making Capabilities With the right insights at your fingertips, decision-making becomes a strategic strength. We empower businesses to move beyond guesswork, using Microsoft Power BI to base decisions on reliable, actionable data. This leads to better outcomes and higher confidence in your strategies. Power BI Development Services Custom Dashboards and Reports Our team designs dashboards and reports tailored to your specific needs. Whether it’s tracking financial performance, operational efficiency, or customer behavior, we ensure the visuals are both engaging and functional. These tools give you the insights you need to act swiftly. Advanced Data Modeling Power BI’s true power lies in its ability to simplify complex datasets. We create advanced data models that streamline your analytics, making it easier to identify trends, relationships, and opportunities. The result? Faster, more accurate insights. Integration with Third-Party Systems From CRM tools like Salesforce to ERP systems such as SAP, our development services ensure seamless integration. This connectivity allows data to flow smoothly between platforms, creating a unified ecosystem for your analytics. Automation of Data Processes Repetitive tasks like data refreshes and report generation can drain time and resources. We help automate these processes within Power BI, ensuring your reports are always up-to-date without manual intervention. Industry Applications of Microsoft Power BI Retail and E-Commerce In the competitive world of retail, understanding customer preferences and sales trends is crucial. Microsoft Power BI helps track inventory, monitor sales, and optimize marketing strategies. By leveraging these insights, retailers can enhance customer experiences and drive revenue growth. Healthcare Analytics For healthcare providers, data can mean the difference between efficient operations and costly inefficiencies. Power BI allows organizations to analyze patient data, monitor hospital performance, and ensure compliance with regulations. This leads to better patient care and optimized resource allocation. Manufacturing and Supply Chain Manufacturers rely on accurate data to minimize downtime and maximize efficiency. Power BI provides insights into production metrics, inventory levels, and supply chain performance. This visibility helps identify bottlenecks and opportunities for improvement. Financial Services From tracking cash flow to analyzing investment performance, Power BI is a game-changer for financial institutions. It simplifies complex datasets, enabling quick and accurate financial forecasting. This leads to better risk management and informed investment decisions. Advanced Power BI Features Data Alerts and Notifications Stay proactive with Power BI’s alert system. Set thresholds for key metrics and receive instant notifications when they’re met or exceeded. This feature ensures you’re always in the loop, even when you’re not actively monitoring the dashboards. Collaborative Tools for Teams Power BI isn’t just a tool for individual analysis—it’s built for collaboration. Share dashboards and reports with your team, encouraging data-driven discussions and collective decision-making. Natural Language Queries Ask Power BI questions in plain English, like “What were last month’s sales in New York?” and get instant visualizations. This intuitive feature makes analytics accessible to everyone, not just data experts. Why Partner with Us? Certified Experts with Proven Experience Our team of certified Power BI consultants brings years of experience to every project. We understand the platform inside out, ensuring your business gets the most out of its capabilities. Comprehensive Support From initial setup to ongoing maintenance, we’re with you every step of the way. Our end-to-end support ensures a smooth transition

Unlock the Full Power of Your Data with Microsoft Power BI Consulting & Development Services Read More »

Power BI consulting services

Unlock New Insights with Our Expert Power BI Consulting Services

Introduction: The Power of Data-Driven Insights In today’s fast-paced business landscape, data is king. But raw data alone doesn’t offer much value—it’s how you interpret it that makes all the difference. That’s where Power BI consulting services, leveraging Microsoft’s powerful business analytics tool, come into play. By transforming your raw data into visually compelling, actionable insights, Power BI consulting services help you stay ahead of the competition. If you’re looking to take full advantage of Power BI, our expert Power BI consulting services are designed to guide you through every step of the process. From setup and customization to advanced data analytics, our consultants ensure your business gets the most out of this powerful tool. What is Power BI? Overview of Power BI Power BI is a suite of business intelligence tools created by Microsoft that enables businesses to visualize their data and share insights across their organization. Whether you’re tracking financial performance, customer behavior, or operational metrics, Power BI provides a comprehensive platform for turning numbers into knowledge. Why Power BI is Essential for Modern Businesses In today’s digital era, businesses are swimming in vast amounts of data. But without a system in place to make sense of that data, opportunities are often missed. Power BI provides an intuitive interface for generating reports, analyzing trends, and making informed decisions in real time. It’s designed to help businesses thrive in a data-driven world by turning chaos into clarity. The Role of Power BI in Data Analytics Turning Raw Data into Actionable Insights Power BI doesn’t just aggregate your data—it helps you understand it. By connecting to multiple data sources, it consolidates information into an easily digestible format. You can then use its array of visualization tools to interpret trends, spot outliers, and drive performance improvements. Real-Time Decision Making with Power BI In business, timing is everything. Power BI enables real-time analytics, so you’re not stuck making decisions based on outdated data. With live dashboards and dynamic reports, you can track KPIs and adjust your strategies on the fly. Why Your Business Needs Power BI Consulting Services Common Data Challenges for Businesses Many businesses face challenges when managing data—disparate sources, complex datasets, and a lack of skilled personnel to properly analyze it. These challenges often lead to poor decision-making and missed opportunities. Without a comprehensive strategy, even the best data goes to waste. Benefits of Expert Power BI Consulting Services This is where Power BI consulting Services comes in. Our experts not only help you set up and customize Power BI but also ensure you get meaningful insights that align with your business goals. Whether you’re new to Power BI or looking to optimize your current setup, our consulting services provide you with a roadmap to success. Our Approach to Power BI Consulting Services Understanding Your Business Goals We begin by understanding your specific business objectives. Whether you’re aiming to improve customer retention, optimize supply chains, or enhance your financial reporting, we tailor our solutions to meet your unique needs. Custom-Tailored Solutions No two businesses are alike, which is why our Power BI solutions are always customized. From selecting the right data sources to building dashboards that fit your organization’s workflows, we ensure everything is perfectly aligned. Data Integration and Analysis Our consulting services focus heavily on data integration. We help you connect various data sources, from internal systems to third-party tools, ensuring seamless flow and analysis. Power BI Training for Your Team Empowering your team to fully utilize Power BI is a key part of our service. We provide comprehensive training to ensure your staff can maximize the platform’s potential, from basic report generation to advanced analytics. Features of Power BI We Focus On Interactive Dashboards and Reports One of Power BI’s standout features is its ability to create highly interactive dashboards. These dashboards allow users to drill down into specific data points, making it easy to uncover insights without getting lost in the details. Data Visualization Tools Power BI offers a range of powerful visualization tools, from simple bar charts to complex heat maps. This allows businesses to present their data in a way that is easy to understand and act upon. Mobile Access and Cloud Integration With Power BI’s mobile-friendly features and cloud integration, you can access your reports from anywhere, anytime, ensuring that you’re never out of the loop when it comes to critical business decisions. Industries Benefiting from Power BI Power BI for Financial Services In the financial sector, accurate and timely data is crucial. Power BI helps financial institutions track performance, manage risk, and improve reporting accuracy, giving them a competitive edge. Power BI for Retail In retail, understanding customer behavior is key. Power BI provides in-depth insights into sales trends, customer preferences, and inventory management, helping businesses optimize their operations. Power BI for Healthcare Healthcare organizations benefit from Power BI by using it to track patient outcomes, manage resources, and improve overall efficiency, leading to better care and reduced costs. How We Help You Maximize ROI with Power BI Cost Efficiency Power BI is known for its affordability compared to other business intelligence tools. Our consulting services help you implement Power BI in a cost-effective manner, ensuring you get the most out of your investment. Scalability for Growing Businesses As your business grows, so does your data. Power BI scales effortlessly with your needs, and our consultants ensure that your setup can handle increased demand without sacrificing performance. Why Choose Our Power BI Consulting Services? Industry Expertise Our team has years of experience across various industries, ensuring we understand your unique challenges and how Power BI can solve them. Dedicated Support and Ongoing Services We provide dedicated support during and after implementation, ensuring your team is fully equipped to use Power BI effectively. Our ongoing services include system maintenance, updates, and continued training. Getting Started with Power BI Consulting Services Initial Consultation The first step in unlocking the full potential of Power BI is to schedule a consultation with our experts. We’ll assess

Unlock New Insights with Our Expert Power BI Consulting Services Read More »

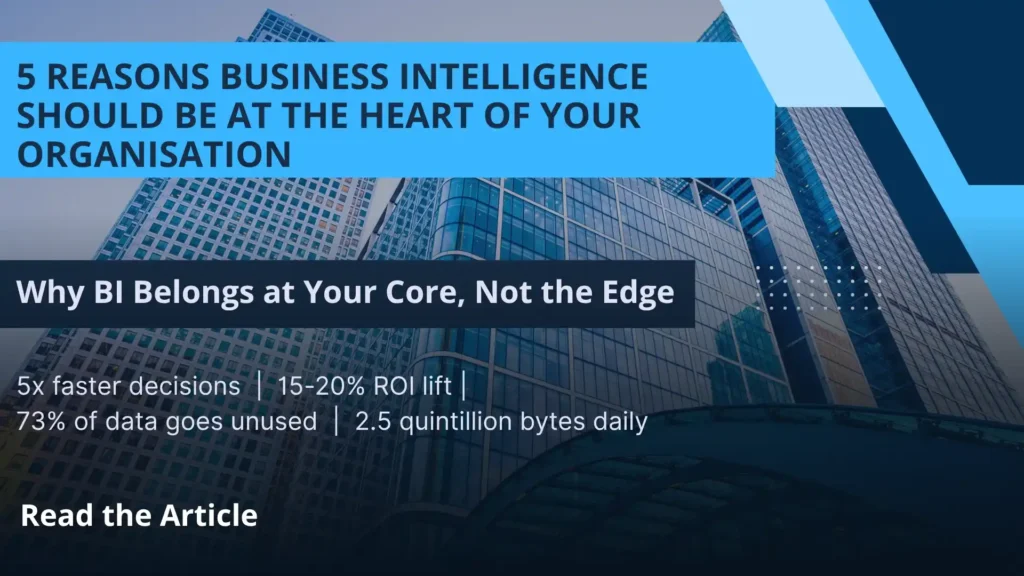
Business intelligence dashboard displaying real-time analytics, KPIs, and organizational insights.

5 Reasons Business Intelligence Should Be at the Heart of Your Organisation

Here is a question worth sitting with: how many decisions does your business make every week based on gut instinct rather than real data? For most organisations, the honest answer is — more than it should. Not because the data does not exist. It does. It sits in spreadsheets, CRM systems, ERP platforms, and finance tools across your organisation. The problem is that it is scattered, siloed, and impossible to see clearly as a whole picture. Business intelligence (BI) is what changes that. It connects your data, organises it into meaningful insights, and puts the right information in front of the right person at exactly the right moment. Here are five compelling reasons why BI should be at the heart of every modern organisation — and why 2025 is the year to make it a strategic priority. What Is Business Intelligence and Why Does It Matter Now? Business intelligence is the technology, processes, and tools that transform raw organisational data into clear, actionable insights. It covers everything from interactive dashboards and real-time reports to advanced analytics and predictive modelling. In today’s digital-first environment, business leaders face a paradox — they have more data than ever before, yet feel less certain about the decisions they are making. BI resolves that paradox. It turns data overload into decision-making clarity. 5 Reasons Every Organisation Needs a BI Strategy 1. Make Smarter, Faster Business Decisions Data is not the same as intelligence. A business manager can be surrounded by reports and spreadsheets and still have no clear picture of what is actually happening — because the data is fragmented, delayed, and inconsistent across systems. BI changes this fundamentally. It creates a single, unified source of truth — pulling data from every corner of your organisation into one place and presenting it clearly through real-time dashboards. Instead of waiting for someone to compile a weekly report, you see exactly where your business stands right now. The result is better decisions, made faster, with genuine confidence behind them. 2. Supercharge Sales and Marketing Performance Sales and marketing teams are most effective when they work from the same data — and when that data tells them exactly where the opportunities are. For sales teams, BI identifies trends in customer behaviour, highlights the accounts most likely to convert, surfaces upsell and cross-sell opportunities, and quantifies pipeline performance in real time. No more guesswork about where to focus time and effort. For marketing, BI makes campaign performance immediately visible — showing which channels, messages, and audiences are delivering results, and which are wasting budget. Teams can adjust campaigns mid-flight based on real evidence rather than waiting for a post-campaign review. When both teams work from the same BI platform, the alignment between sales and marketing improves dramatically — and so do the revenue results. 3. Eliminate Inefficiencies and Boost Productivity Every organisation has processes that consume more time and resources than they should. The challenge is that inefficiencies are often invisible — buried in the day-to-day routine and never questioned because “that is how we have always done it.” BI makes inefficiencies visible. It identifies bottlenecks in production workflows, reveals where time is being lost in sales cycles, highlights which processes are underperforming against targets, and automates the routine reporting tasks that consume hours of management time every week. The productivity gains from a well-implemented BI strategy are felt across every department — from customer service and operations to finance and product development. 4. Improve Data Quality and Accuracy Across the Business When data lives in separate systems — a CRM here, an ERP there, a spreadsheet somewhere else — inconsistencies multiply silently. The same customer appears in three systems with three different records. Sales figures differ between the finance report and the sales report. Nobody is sure which number to trust. This is not just an inconvenience. Poor data quality leads to wasted marketing spend, missed sales opportunities, flawed forecasts, and brand damage from miscommunication with customers. BI addresses this at the root. By centralising data and creating a single validated source of truth, it surfaces inconsistencies and gaps that would otherwise remain hidden — improving the accuracy and reliability of every business decision that depends on data. 5. Deliver a Measurable, Business-Wide ROI Every investment decision your organisation makes should have a measurable return — and BI investment is no different. The good news is that the ROI from a well-implemented BI strategy tends to be both significant and multi-dimensional. Better decisions lead to more revenue. Eliminated inefficiencies reduce costs. Improved data quality reduces waste. Smarter sales and marketing generates higher conversion rates. Together, these improvements compound — creating a measurable uplift in business performance that justifies the investment many times over. Organisations that treat BI as a strategic priority consistently outperform those that do not — not because they have access to different data, but because they use their data more intelligently. What Business Intelligence Looks Like in Practice The best BI implementations are not complex IT projects. They are practical, accessible tools that become part of how people work every day. A sales director starts each morning with a dashboard showing pipeline health, conversion rates, and this week’s revenue forecast — updated overnight from live system data. A marketing manager checks campaign ROI in real time — adjusting spend toward channels that are converting and pulling back from those that are not. A CEO reviews a single consolidated view of company-wide performance — financial, operational, and customer — in one place, in minutes rather than hours. This is what BI enables. And with modern cloud-based platforms, this level of insight is accessible to organisations of every size. How Microsoft Power BI Delivers All 5 Benefits Microsoft Power BI is one of the world’s most widely adopted business intelligence platforms — and for good reason. It connects natively to Microsoft Dynamics 365, Azure, Excel, SQL databases, and hundreds of third-party data sources — bringing all your organisational data into one unified analytics environment. Interactive dashboards

5 Reasons Business Intelligence Should Be at the Heart of Your Organisation Read More »

How to Transform Your Business Data Into Actionable Insights: A Complete BI and Analytics Guide

Your business is generating more data than ever before. The question is — are you doing anything useful with it? Most organizations today are data-rich but insight-poor. They collect vast amounts of operational, financial, and customer data across multiple systems — and then struggle to turn any of it into decisions that actually move the business forward. Reports are produced. Dashboards are built. And yet, leadership teams still find themselves making critical decisions based on gut instinct rather than verified, real-time intelligence. That is the problem that business intelligence and data analytics solutions are designed to solve. By connecting your data sources, structuring your information architecture, and surfacing insights through intuitive visualizations and predictive models, the right BI platform transforms raw data from a liability into your most powerful strategic asset. Trident’s Data Analytics Solutions — built on Microsoft Dynamics 365, Power BI, and leading cloud platforms — give organizations of every size the ability to move from basic reporting to real-time monitoring, predictive forecasting, and data-driven decision-making at every level of the business. Whether you are just beginning your analytics journey or looking to mature a complex enterprise BI environment, Trident has the expertise, tools, and methodology to take you there. Why Most Businesses Are Sitting on Data They Cannot Use The Gap Between Data Collection and Data-Driven Decision Making Data collection has never been easier. Every transaction, every customer interaction, every operational process generates a trail of structured and unstructured data. But collecting data and extracting value from it are two entirely different capabilities — and most businesses have invested heavily in the former while neglecting the latter. The result is data silos: marketing data locked in one platform, financial data in another, operational data in a legacy ERP that barely talks to anything else. Without a unified analytics layer connecting these sources, the data your business generates every day remains invisible to the people who need it most. What Actionable Business Intelligence Actually Looks Like Actionable business intelligence is not a dashboard full of numbers. It is the right insight, delivered to the right person, at the right moment — with enough context to drive a confident decision. It is a sales manager who can see which accounts are at risk of churning before they receive a cancellation notice. It is an operations director who can forecast supply chain disruption three weeks before it happens. It is a CFO who can model the financial impact of a strategic decision in real time, without waiting for the finance team to build a spreadsheet. That is what Trident’s Power BI and analytics solutions are built to deliver. Advance Your Analytics Journey With Trident Data Insights From Reporting to Monitoring: Accelerating Your Power BI Maturity Most organizations start their analytics journey at the same place — basic reporting. Someone needs a number, someone builds a report, and that report gets emailed as a PDF once a week. It works, barely, until the business grows to the point where weekly reports are too slow, too static, and too disconnected from the operational reality on the ground. Trident’s Data Analytics Solutions are designed to rapidly accelerate your organization from passive reporting to active monitoring — giving your teams live visibility into the metrics that matter, with the ability to drill down, explore trends, and act on what they find without waiting for the next report cycle. Connecting Microsoft Dynamics 365 and Legacy Systems to One Analytics Layer One of the most common Power BI challenges enterprises face is fragmented data across modern and legacy platforms. Trident’s Data Insights platform connects directly to your existing deployed applications — including Microsoft Dynamics 365 for Operations and legacy Dynamics AX 2012 — creating a single, unified source of truth for all your analytical data. Historical trending — understand how your business has performed over time Drill-down reporting — move from high-level KPIs to granular transaction-level detail in seconds Operational and financial insights — unified visibility across every function of the business Single source of truth — eliminate conflicting data versions across departments Our Business Intelligence and Analytics Service Offerings Trident offers a comprehensive suite of Power BI and data analytics services — from initial strategy and maturity assessment through to full platform implementation, visualization development, and ongoing analytics optimization. Business Strategy and Enterprise Metrics Before building any analytics platform, the right strategy must be in place. Trident’s business strategy services include: Enterprise information management strategy and roadmap development Business information health assessments to identify gaps and opportunities Business case development to justify BI investment to stakeholders Platform and tool evaluations to ensure the right technology fit Architecture definition and enterprise metrics management H3BI Capabilities: Rationalization, Consolidation and Cloud Reporting Many organizations have accumulated multiple overlapping Power BI tools over time — each serving a different team, none talking to each other. Trident’s Power BI rationalization service consolidates your analytics environment into a coherent, scalable platform that serves the entire organization: BI rationalization and consolidation across siloed tools and platforms Data visualization and analytic application development BI Centre of Excellence establishment for long-term analytics governance Cloud reporting capabilities for anywhere, anytime access to business insights Analytic Applications and Web Analytics Beyond standard business reporting, Trident builds purpose-built analytic applications tailored to your industry and business model — including enterprise analytics services, industry-specific solutions, and web analytics integration that connects your digital performance data to your broader business intelligence environment. Information Infrastructure and Data Governance Insights are only as reliable as the data behind them. Trident’s information infrastructure services ensure your data foundation is solid before any visualization or analytics layer is built on top of it: Data modelling, architecture design, and integration Centre of Excellence Master data management and metadata management Data quality management and governance frameworks Data warehouse performance improvement, design, and development Quality assurance, auditing, and regulatory compliance support Data Visualization: Turning Raw Numbers Into Business Decisions KPIs, Dashboards and Real-Time Metrics for CXOs and Managers Data only becomes valuable when it can

How to Transform Your Business Data Into Actionable Insights: A Complete BI and Analytics Guide Read More »