
Every pharmacy has drugs that are silently draining profit. The problem is most owners don’t know which ones — until it’s too late. A medicine sitting on the shelf past its expiry date. A high-cost drug with razor-thin margins being sold without discount controls. A slow-moving SKU tying up valuable shelf space and working capital month after month. These are not exceptional situations. They happen every day in pharmacies that are running without real-time data visibility.
Power BI pharmacy dashboards change that completely. They give pharmacy owners, chain managers, and finance teams a live, visual window into exactly which drugs are costing you money — and why.
The Problem With How Most Pharmacies Track Drug Performance
Most pharmacies still rely on monthly reports, weekly stock counts, and end-of-day billing summaries to understand their business performance. By the time the data reaches a decision-maker, it is days or weeks old. The slow-moving stock has already aged further. The margin-eroding drug has already been sold at a loss hundreds of times.
The pharmaceutical industry is seeing an enormous shift toward real-time analytics. 69% of commercial pharmacy teams are actively increasing their spending on data analytics solutions, and more than 85% of pharma executives plan to increase investment in data and digital tools through 2026. The reason is simple: pharmacies that see their data in real time make better decisions, faster.
Power BI is the tool making this possible for pharmacies of every size.
What Is a Power BI Pharmacy Dashboard?
Microsoft Power BI is a business intelligence platform that connects to your pharmacy management system, ERP, or billing software and transforms raw transaction data into live, interactive visual dashboards.
For pharmacies specifically, a Power BI dashboard pulls data from your point-of-sale system, inventory records, purchase orders, and financial reports — and presents it in a single screen that updates automatically, in real time.
No manual reports. No spreadsheet exports. No waiting until month-end to find out where your money went.
Seeing Your Top 10 Money-Losing Drugs in Real Time
This is where Power BI delivers its most immediate and powerful value for pharmacy owners.
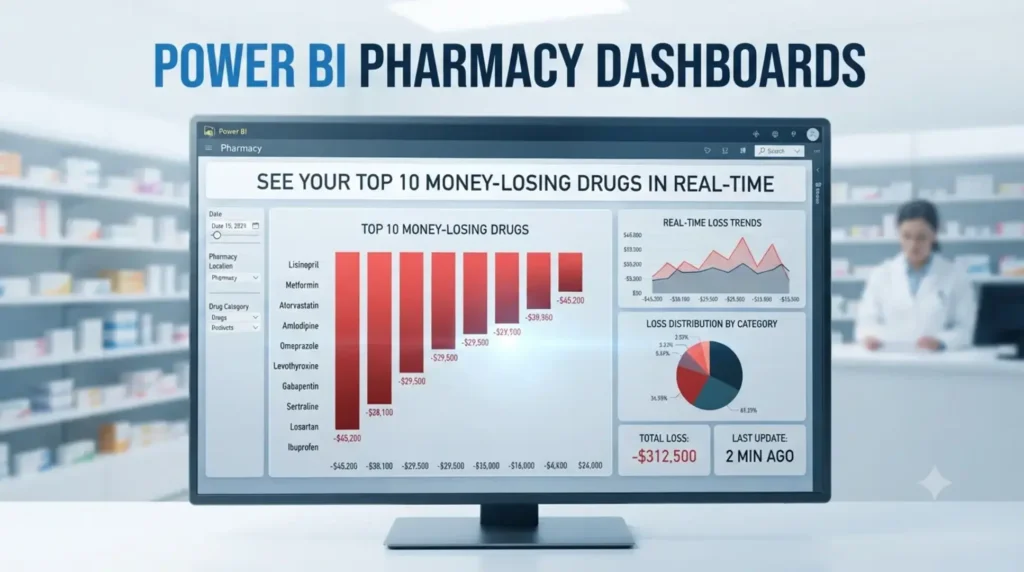
A well-built Power BI pharmacy dashboard can show you — right now, today — a ranked list of your top 10 money-losing drugs based on multiple profitability factors:
Margin loss — drugs being sold below or too close to cost price due to pricing errors, discount overrides, or supplier price changes not reflected in your selling price.
Dead stock value — medicines that have not moved in 30, 60, or 90 days, with the total capital value tied up in each. A visual ranking of these by rupee value makes the cost of inaction immediately visible.
Expiry loss forecast — drugs whose current stock will expire before projected consumption. The dashboard flags these before the loss occurs — not after.
High-return rate drugs — medicines being returned at higher-than-average rates, signalling quality, storage, or dispensing issues that are quietly eroding revenue.
Purchase price vs selling price variance — automatic alerts when your supplier raises a drug’s cost price but your selling price hasn’t been updated, creating an invisible margin gap on every sale.
One pharma analytics implementation reported a 40% reduction in reporting cycle time and a significant improvement in revenue tracking accuracy after deploying Power BI dashboards. For a pharmacy chain, that kind of visibility translates directly into faster decisions and recovered margin.
Key Metrics Your Power BI Pharmacy Dashboard Should Track
Beyond the top 10 money-losing drugs, a comprehensive Power BI pharmacy dashboard gives you live visibility across:
Sales Performance
- Revenue by drug, category, brand, and generic
- Daily, weekly, and monthly sales trends
- Actual sales vs target by branch and by product
Inventory Intelligence
- Real-time stock levels across all locations
- Days of inventory remaining per SKU
- Slow-moving and non-moving stock ranked by value
- Expiry date alerts by batch and by location
Margin and Profitability
- Gross margin by drug and by category
- Purchase cost vs selling price live comparison
- Discount impact on margin by product
- Most and least profitable SKUs ranked visually
Supplier and Purchase Analytics
- Supplier-wise purchase value and volume
- Price trend analysis by supplier
- Purchase order vs actual delivery tracking
Branch and Multi-Location Performance
- Revenue, margin, and stock performance by outlet
- Comparative branch performance on a single screen
- Regional managers see only their location data — chain owners see everything
Why Power BI Works So Well for Pharmacy Analytics
The reason Power BI has become the go-to analytics platform for pharmacies — particularly those running on Microsoft Dynamics 365 or similar ERP systems — comes down to three things.
Seamless integration. Power BI connects directly to your pharmacy management system, ERP, billing software, SQL databases, and even Excel files — with no manual data export required. Data flows in automatically and dashboards update in real time.
No IT team required. As of 2026, Power BI’s Copilot feature allows pharmacy managers to query their own data using natural language — asking questions like “which drugs had the lowest margin last month” and getting an instant visual answer without writing a single formula.
Affordable at every scale. Power BI starts at approximately $14 per user per month — making enterprise-grade pharmacy analytics accessible to independent pharmacies, not just large chains.
The Competitive Advantage of Real-Time Pharmacy Analytics
Pharmacies operating with real-time Power BI dashboards are making decisions that their competitors simply cannot make — because their competitors don’t have the data.
They catch margin erosion before it compounds. They clear dead stock before it expires. They identify their money-losing drugs in real time and take corrective action within hours — not weeks.
In an industry where margins are already thin and competition is intense, that visibility is not a luxury. It is the difference between a profitable pharmacy and one that is slowly losing money without knowing why.
Power BI doesn’t just show you your top 10 money-losing drugs. It gives you the power to stop losing money on them — starting today.
Trident Information Systems integrates Microsoft Power BI with Dynamics 365-based pharmacy management solutions, giving pharmacy chains real-time profitability dashboards configured for your specific business. Talk to our experts at tridentinfo.com/contact.