
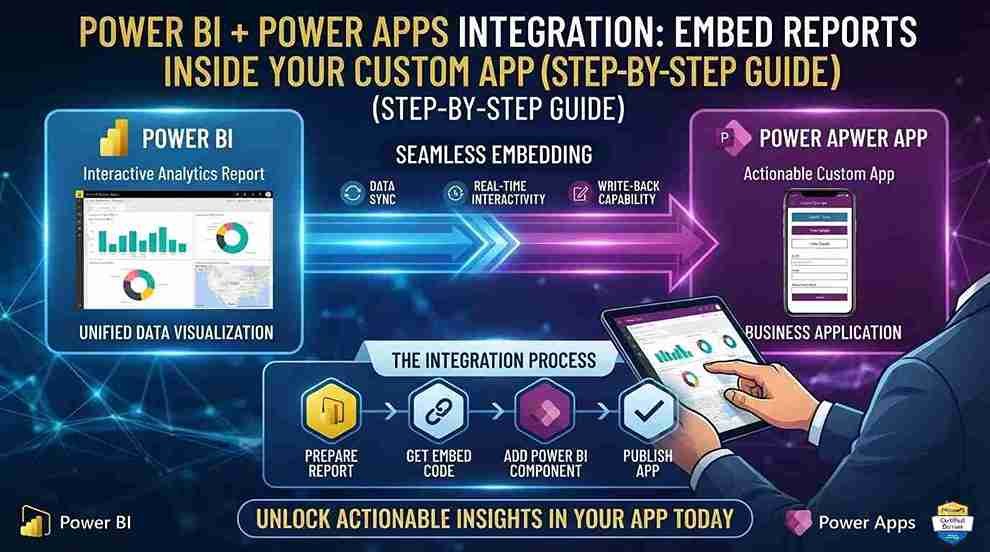
Combining Power BI and Power Apps means your team can view live reports and act on the data — approve a request, update a record, adjust a quota — without switching applications. But before you start building, there’s one decision that determines your entire setup: are you embedding a report for internal employees, or for external users who don’t have Power BI licenses? Those are two different integrations, and picking the wrong one wastes a build.
This guide covers the more common scenario — embedding a Power BI report inside an internal Power Apps canvas app — step by step, plus how to tell if you actually need the other path instead.
Which Integration Do You Need?
Power BI tile in Power Apps (this guide): adds a live Power BI report inside a canvas app using the built-in Power BI control. Your users need Power BI Pro licenses. No Azure resource required. Setup takes under 15 minutes once you have the report ready.
Power BI Embedded (Azure service): embeds Power BI reports into external-facing apps for customers or users who don’t have Power BI licenses at all. Requires an Azure capacity resource, billed per capacity unit, and a development effort well beyond a canvas app control.
If you’re building an internal tool for employees who already have Microsoft 365/Power BI Pro licenses, use the tile method below. If you’re building something customer-facing where your users have no Power BI license, skip to the Power BI Embedded section at the end.
Before You Start: Licensing and Access
- Report owner/maker: needs a Power BI Pro license and edit access to the report you’re embedding.
- App users: need Power BI Pro licenses too — a free Power BI account cannot view an embedded report, no matter how the app itself is licensed or shared.
- Report sharing is separate from app sharing. Sharing your Power App with a user does not automatically give them access to the underlying Power BI report. You have to share both — this is the single most common reason people see a blank tile or a permissions error after everything else looks correctly configured.
Step 1: Get Your Report Ready in Power BI
Open powerbi.com and identify the report you want to embed. Publish it to a workspace if it isn’t already, and confirm it’s the exact version you want your app users to see — changes here reflect immediately in every app that embeds it.
Step 2: Open or Create Your Canvas App
In make.powerapps.com, select Create, then Canvas app from blank. Name your app and choose a format — Tablet gives you more working space for a report; Phone is better if the app is primarily mobile.
Step 3: Insert the Power BI Tile
On the screen where you want the report to appear, go to Insert → Charts → Power BI tile. Power Apps will drop a placeholder control onto the canvas — this is the container the report will render inside.
Step 4: Connect the Report to the Tile
Back in Power BI, open the report, select File → Embed report → Website or portal, and copy the embed link it generates. In Power Apps Studio, select your Power BI tile control and paste that link into the TitleURL property. Resize and position the tile to fit your screen layout.
Step 5: Share the Report — Not Just the App
Before testing with real users, explicitly share the underlying Power BI report with everyone who’ll use the app (or the workspace it lives in), separately from sharing the app itself. Skipping this step is what produces the “Ask the report owner to share it with you” error even for users who technically have app access.
Step 6: Test With a Real User Account
Save and publish your app, then test it logged in as an actual end user — not as the maker/admin. Admin accounts often have implicit access that masks a permissions gap a normal user will hit immediately.
When You Need Power BI Embedded Instead
If your use case is customer-facing — a client portal, a partner-facing dashboard, anything where the viewer doesn’t have (and shouldn’t need) a Power BI license — the tile method above won’t work, because it still requires each viewer to be individually licensed. Power BI Embedded solves that by licensing the capacity, not the user, but it requires an Azure resource, app registration, and development work beyond what a canvas app control can do on its own. That’s a build we’d scope separately rather than cover step-by-step here.
Where This Fits Into a Bigger Picture
Embedding a single report is often the first step toward a broader Power BI + Power Apps pattern — dashboards that let a manager not just view a KPI but act on it directly, writing back to the source data and seeing the report update in real time. If that’s the direction you’re heading, the report itself needs to be built with that interactivity in mind from the start, not retrofitted later.
Need Help Building This Into Your Business Systems?
If your reports live on top of Dynamics 365 Business Central, F&O, or another ERP, embedding them correctly means getting the data model, security roles, and licensing aligned — not just dropping a tile onto a screen. Contact Trident for help embedding Power BI into your Power Apps or line-of-business systems.