Welcome to Trident Information Systems!
Write us to - info@tridentinfo.com
Let's Socialize
LS Central retail dashboard displaying POS, inventory, eCommerce, customer loyalty, and omnichannel operations for GCC retailers.

LS Central for Retail: Unlocking Omnichannel Success in the Competitive GCC Market

The GCC retail market is one of the fastest-growing and most demanding retail environments in the world — and the bar for omnichannel excellence has never been higher. The Middle East e-commerce market reached USD 155 billion at the end of 2025 and is on track to hit USD 177 billion in 2026. The GCC retail market is projected to grow from USD 309.6 billion to USD 386.9 billion by 2028. More than half the GCC population is under 30 — digitally native, brand-conscious, and expecting seamless shopping experiences across every channel they use. For retailers across Saudi Arabia, the UAE, Kuwait, Qatar, Bahrain, and Oman, this creates a clear divide: those delivering unified omnichannel experiences and those losing customers to competitors who do. LS Central is the platform closing that divide — the unified commerce solution GCC retailers are choosing to power their next phase of growth. Why GCC Retailers Are Struggling With Omnichannel The ambition to go omnichannel is universal among GCC retailers. The execution is where most fall short. The failures are predictable: Fragmented inventory — stock data does not sync in real time between physical stores and e-commerce platforms. Customers order online and receive cancellations because the system showed inventory that was already sold in-store. Disconnected customer data — CRM, POS, and e-commerce systems operate in isolation. A customer who spent AED 50,000 in your flagship Dubai mall store is treated as a stranger when they visit your Riyadh outlet or shop on your website. Channel conflict — online and offline teams operate separate P&Ls with separate targets, creating internal competition instead of a unified customer journey. Inability to fulfil cross-channel — click-and-collect, ship-from-store, and endless aisle capabilities are impossible when inventory systems are not connected in real time. Saudi Vision 2030 and UAE National Retail Strategy are both accelerating digital transformation expectations — and retailers who cannot meet the connected commerce standard will compete at a structural disadvantage. What Is LS Central and Why Does It Matter for GCC Retail? LS Central is a unified retail management platform built on Microsoft Dynamics 365 Business Central — combining POS, inventory, loyalty, e-commerce, supply chain, and financial reporting into one cloud-native system that eliminates the silos blocking true omnichannel retail. For GCC retailers, LS Central delivers what no patchwork of disconnected systems can: One inventory — everywhere. Stock levels update in real time across every store, warehouse, and online channel simultaneously. A product sold in the Dubai Mall store is immediately unavailable online. A product ordered online can be fulfilled from the nearest store without manual intervention. One customer view — across all touchpoints. Every customer interaction — in-store purchase, online browse, loyalty redemption, click-and-collect pick-up — feeds into a single customer profile. Store staff in Abu Dhabi can see a customer’s complete purchase history, loyalty balance, and preferences instantly — whether that customer usually shops in Riyadh or on the website. One platform — for every channel. In-store POS, e-commerce, mobile app, self-service kiosk, and social commerce all run on the same LS Central platform. Promotions, pricing, loyalty programmes, and product catalogues are managed centrally and applied consistently across every channel — automatically. The GCC-Specific Capabilities That Make LS Central Stand Out GCC retail has unique requirements that generic omnichannel platforms simply were not built for. LS Central addresses them directly: Arabic language and RTL support — full right-to-left interface and Arabic language support across POS, back-office, and customer-facing screens — essential for localised staff and customer experience. VAT and regional tax compliance — LS Central handles GCC VAT regulations natively, with compliant invoicing across Saudi Arabia, UAE, and all GCC countries built into the platform from day one. Loyalty and personalisation at scale — GCC consumers respond exceptionally well to personalised loyalty experiences. LS Central’s integrated CRM drives loyalty programmes, targeted promotions, and personalised offers that build the long-term customer relationships GCC retailers depend on. Multi-currency and multi-entity management — for retail groups operating across multiple GCC countries with different currencies and regulatory environments, LS Central manages everything within a single platform instance. Scalability for expansion — as Saudi Vision 2030 and UAE economic diversification accelerate retail sector growth, LS Central scales with new store openings, new markets, and new channels without additional IT infrastructure investment. Real Business Impact for GCC Retailers Retailers implementing LS Central consistently report measurable results: The Bottom Line for GCC Retailers in 2026 The GCC consumer in 2026 does not see channels. They see your brand — and they expect it to deliver a consistent, personalised, frictionless experience whether they are in your Dubai flagship, your Riyadh outlet, or your app at midnight. LS Central is the unified commerce platform that makes that experience possible — at the scale, compliance level, and operational complexity that GCC retail demands. The retailers winning the GCC market in 2026 are running on one platform. That platform is LS Central. Trident Information Systems is a certified LS Central and Microsoft Dynamics 365 implementation partner operating across the GCC, India, UK, and Africa. Talk to our retail experts at tridentinfo.com/contact

LS Central for Retail: Unlocking Omnichannel Success in the Competitive GCC Market Read More »

AI-powered retail video analytics system monitoring customer behavior, store traffic, and theft prevention.

Retail Video Analytics: How AI-Powered Cameras Increase Sales, Reduce Theft & Improve Customer Experience

Retail shrinkage hit USD 112 billion in 2025 — and traditional cameras caught fewer than 2% of the people responsible. AI-powered retail video analytics changes that equation entirely, turning every camera in your store into a real-time intelligence asset that increases sales, prevents theft, and elevates customer experience. Your store cameras are recording everything. But are they actually doing anything? Most retail security cameras are passive — they document what happened after it is already too late. A theft is captured on footage. A queue builds unnoticed until customers walk out. A high-value display sits in a low-traffic aisle because nobody tracked footfall patterns. In 2026, that is no longer good enough — and the numbers make that clear. Global retail shrinkage reached USD 112.1 billion in 2024. Fewer than 2% of shoplifters are ever caught. And retailers still relying on traditional CCTV are losing money daily to theft, missed sales opportunities, and poor store layouts — without knowing it. AI-powered retail video analytics changes every one of these outcomes. Here is exactly how. What Is Retail Video Analytics? Retail video analytics applies artificial intelligence and computer vision to your existing camera infrastructure — transforming passive footage into real-time, actionable business intelligence. It does not just record. It analyses, detects, alerts, and gives managers a live view of what is happening on the floor so they can act in the moment. In 2026, AI video analytics is no longer reserved for enterprise retailers — mid-size chains, supermarkets, and pharmacy chains are all deploying it because the ROI is measurable and fast. 1. Increase Sales Through Smarter Store Intelligence Every square metre of your retail floor has revenue potential. The question is whether you are maximising it — or guessing. AI-powered cameras track customer movement patterns in real time, generating heat maps that show exactly where shoppers spend time, which zones they avoid, and where traffic naturally flows. This data reveals: Armed with this intelligence, retailers optimise layouts, reposition displays, and staff the right areas at the right times — directly lifting conversion rates and basket values. Retail video analytics also calculates your conversion rate accurately — foot traffic counted at the door versus transactions at the POS — giving you a metric that is impossible to track without camera-based counting. If 500 people enter your store and only 80 buy, video analytics tells you where the other 420 left without purchasing — and why. 2. Reduce Theft and Shrinkage in Real Time Retail shrinkage costs the industry over USD 120 billion annually across North America alone — more than double pre-2020 levels. External theft accounts for 37% of losses, employee theft 29%, and process errors 21%. Traditional cameras record theft after it happens. AI video analytics detects it before merchandise leaves the store. Key capabilities that make this possible in 2026: Behavioural detection — AI identifies suspicious patterns in real time: loitering near high-value merchandise, unusual concealment movements, and extended dwell times in restricted areas — triggering instant alerts to security staff. Self-checkout loss prevention — self-checkout lanes run 2–7 times higher loss rates than staffed lanes. AI cameras at the bagging area monitor items in real time, flagging scan-skip attempts and item substitution before the transaction completes. POS transaction correlation — video footage is matched to POS data automatically, detecting employee fraud patterns, void abuse, and sweethearting that manual monitoring consistently misses. Organised retail crime detection — AI systems identify repeat offenders and coordinated group behaviour across camera feeds simultaneously — a capability no human monitor team can replicate at scale. A well-implemented AI video analytics system can take 0.2–0.4 percentage points off a retailer’s shrinkage rate — which for a 200-store chain running at 1.8% shrinkage translates to hundreds of thousands in recovered revenue annually. 3. Improve Customer Experience Through Operational Intelligence The customer experience begins the moment someone enters your store — and AI-powered cameras track every touchpoint of that journey. Queue management — AI monitors checkout queue lengths in real time and alerts managers when thresholds are crossed. Customers who abandon queues represent direct lost revenue. Real-time queue intelligence allows staffing decisions to be made in minutes, not after post-day reports. Staff deployment — heat map data aligned with historical footfall patterns allows store managers to position staff where customers are — not where instinct suggests they should be. Demographic and behaviour insights — anonymised customer flow data reveals how different customer groups navigate the store, how long they engage with specific displays, and what layout changes improve dwell time and purchase intent. Out-of-shelf detection — AI cameras flag empty shelves automatically, enabling faster replenishment during peak trading hours and preventing the lost sales that empty shelves create. Every one of these improvements lifts customer satisfaction, basket size, and repeat visit rates — the metrics that drive long-term retail profitability. Why Retailers Are Deploying AI Video Analytics Now In 2026, anonymised skeleton and keypoint-based analytics deliver full behavioural intelligence without facial recognition — addressing regulatory concerns while maintaining complete operational capability. Retailers deploying this now are building a competitive advantage their competitors simply cannot replicate with traditional cameras. Your cameras are already installed. AI video analytics makes them work. Trident Information Systems integrates AI-powered retail video analytics with Microsoft Dynamics 365 and LS Retail solutions — giving retail chains real-time store intelligence across all locations. Talk to our experts at tridentinfo.com/contact.

Retail Video Analytics: How AI-Powered Cameras Increase Sales, Reduce Theft & Improve Customer Experience Read More »

Cloud pharmacy software dashboard displaying real-time inventory, patient records, prescription management, and multi-store performance.

Cloud Pharmacy Software: Best Solutions for Remote & Multi-Location Pharmacies

Running a pharmacy chain across multiple locations — or serving patients in remote areas — is an entirely different operational challenge from managing a single outlet. Stock discrepancies between branches. Prescription records that don’t follow the patient. Billing systems that can’t talk to each other. Decisions made on data that is days old. If any of this sounds familiar, the problem is not your people. It is your technology. Cloud pharmacy software was built to solve exactly this — and in 2026, it has become the foundation on which the fastest-growing pharmacy chains and telepharmacy networks operate. The global pharmacy management system market has grown to USD 101 billion in 2025 and is projected to reach USD 207 billion by 2030 at a 15.47% CAGR. Cloud deployment already accounts for over 63% of that market and is growing at a 15.9% CAGR — driven by multi-location operators who simply cannot function without it. What Is Cloud Pharmacy Software? Cloud pharmacy software is a browser or app-based pharmacy management platform hosted on secure remote servers — rather than on a local computer or in-store server. Every branch, pharmacist, and authorised manager accesses the same system, same data, and same real-time inventory — from anywhere, on any device. No installation, no manual data sync, no risk of losing records if a local server fails. Why Multi-Location Pharmacies Are Switching to Cloud 1. Real-Time Inventory Visibility Across All Branches The most painful problem for multi-location pharmacy chains is stock imbalance — one branch sitting on excess inventory while another turns away patients due to stockouts of the same medicine. Cloud pharmacy software eliminates this entirely. Stock levels across every outlet update in real time. Managers transfer stock between branches instantly and make restocking decisions on live data — not last week’s count. Cloud-first platforms have enabled a 55% improvement in multi-location data access. 2. Centralised Patient and Prescription Records In a multi-location pharmacy, patients should be able to walk into any branch and receive seamless service — with their full prescription history, loyalty points, and doctor notes instantly accessible. With on-premise systems, this is impossible. With cloud pharmacy software, every patient profile updates in real time across every outlet. A patient registered at your Connaught Place branch can pick up a prescription refill at your Noida branch with zero friction — and that kind of experience builds loyalty competitors cannot easily break. 3. Remote and Telepharmacy Operations The global telepharmacy market is projected to grow at a 15.8% CAGR through 2030 — driven by demand from rural communities, underserved regions, and patients seeking remote pharmaceutical care. Cloud pharmacy software is the backbone of telepharmacy. It enables pharmacists to verify prescriptions, review patient medication history, and supervise dispensing remotely — without being physically present at the dispensing location. For pharmacy chains expanding into Tier-2 and Tier-3 cities, cloud-based telepharmacy is no longer optional — it is a competitive requirement. 4. Compliance and Audit Readiness Across All Locations Managing regulatory compliance across multiple branches manually is resource-intensive and error-prone. Drug licensing, Schedule H and H1 records, GST invoicing, narcotic registers — all need to be accurate at every outlet and audit-ready at any moment. Cloud pharmacy software centralises this automatically. Every transaction, prescription, and batch record is logged in real time — accessible from one dashboard and exportable for inspections without manual preparation. 5. Scale Instantly Without IT Overhead Every time a traditional pharmacy chain opens a new branch, it means procuring hardware, installing software, and configuring local systems. Cloud pharmacy software removes this entirely. Adding a new branch is a configuration task — not an IT project. The new outlet connects to your existing platform within hours. Key Features to Look for in Cloud Pharmacy Software Before selecting a platform, ensure it covers: Cloud vs On-Premise: Why Cloud Wins Factor Cloud Pharmacy Software On-Premise System Setup time Hours Days to weeks Multi-branch access Real-time, automatic Manual sync required Scalability Instant Hardware investment per location Data backup Automatic, cloud-secured Manual, local risk Compliance records Centralised, audit-ready Scattered across locations Cost model Monthly subscription High upfront capital Remote access Full access anywhere Limited or VPN-dependent The Bottom Line Cloud pharmacy software is not a feature upgrade — it is a fundamental shift in how multi-location and remote pharmacies operate, giving every branch and patient a connected, real-time experience. In 2026, the pharmacies growing fastest are the ones that moved to the cloud first. Trident Information Systems delivers cloud-based pharmacy management solutions built on Microsoft Dynamics 365 — covering inventory, billing, compliance, patient management, and multi-branch operations for pharmacy chains across India, UAE, and Africa. Talk to our experts at tridentinfo.com/contact.

Cloud Pharmacy Software: Best Solutions for Remote & Multi-Location Pharmacies Read More »

Business team evaluating CRM software features, customer data, sales pipeline, and analytics.

5 ways to find appropriate CRM solution for your organisation

With hundreds of CRM options in the market and a global CRM industry projected to reach USD 126 billion in 2026 — choosing the right one for your organisation has never been more important, or more confusing. 57% of CRM users say their CRM is critical to their organisation. Yet 90% of organisations admit that less than half of their CRM data is accurate and complete. That gap between potential and reality almost always comes down to one thing: the wrong CRM was chosen in the first place. Selecting a CRM is not just a software decision. It is a strategic commitment that affects your sales team, marketing function, customer service operations, and ultimately your revenue. Get it right and your CRM becomes the engine of growth. Get it wrong and it becomes an expensive system nobody uses. Here are 5 proven ways to find the right CRM solution for your organisation in 2026 — and avoid the mistakes that derail most selection processes. 1. Start With Your Business Processes — Not the Software Features The single most common CRM selection mistake is leading with features. Teams get dazzled by AI dashboards, automation workflows, and integration capabilities — and forget to ask the most important question first: how does our organisation actually sell, market, and serve customers today? Before you open a single vendor website, map your current processes: Your CRM needs to match these workflows — not force your team to adapt to a new way of working from day one. By 2026, 70% of new enterprise CRM applications are being built using low-code or no-code tools precisely because organisations need systems that flex to their processes, not the other way around. Document your current process before you evaluate a single vendor. This becomes your requirements benchmark. 2. Define Your Must-Have vs Nice-to-Have Features Once you understand your processes, translate them into a structured feature list — split into two categories: must-have and nice-to-have. Must-haves are non-negotiable. A CRM without them fails your organisation regardless of how impressive its other capabilities are. Common examples include: Nice-to-haves are features that would add value but are not deal-breakers. AI-powered lead scoring, advanced territory management, social listening integration, or built-in configure-price-quote tools might fall here depending on your maturity level. This two-tier list prevents you from paying for capability you will never use — and stops you from choosing a CRM that looks impressive in a demo but cannot do the three things your team does every day. In 2026, 90% of buyers say they are more likely to choose software with AI capabilities — but AI is only valuable if the core CRM function is solid first. 3. Evaluate Integration Capability With Your Existing Tech Stack A CRM does not operate in isolation. It lives alongside your ERP system, email platform, marketing automation tools, customer support software, and financial reporting stack. If it cannot talk to these systems fluently, you will end up with more data silos than you had before. 68% of organisations integrate their CRM with marketing automation tools. 74% use CRM to improve customer retention and automate sales management. Both of these use cases only work when the CRM is connected — not isolated. Before shortlisting any CRM, audit your existing technology stack and ask every vendor the same questions: For organisations running Microsoft Dynamics 365, ERP, or other Microsoft products — Microsoft Dynamics 365 CRM offers a native, deeply integrated ecosystem that eliminates the integration complexity that plagues mixed-vendor technology stacks. Everything from Outlook and Teams to Power BI and Azure connects out of the box. 4. Assess Total Cost of Ownership — Not Just the Licence Fee The licence fee is the number vendors put in the headline. The total cost of ownership is the number that actually matters — and it is almost always higher. When evaluating CRM solutions, calculate the full cost picture: Implementation and configuration — customising the CRM to match your processes, migrating existing data, and configuring integrations all carry cost beyond the licence. Training and adoption — a CRM your team does not use is worth nothing. Budget for structured onboarding, training programmes, and change management support. Ongoing support and maintenance — who supports the system when something breaks? What does a support contract cost? How frequently does the vendor release updates and what do upgrades involve? Scalability costs — what happens to your licence fee when you add 50 more users? When you open a new market? When you add a new business unit? 84% of companies looking for CRM software have under 1,000 employees — meaning most organisations are making this decision without enterprise-level IT resources. Choosing a vendor with a clear, transparent pricing model and a strong implementation partner makes the difference between a smooth rollout and a costly failure. 5. Prioritise Vendor Stability and Implementation Partner Quality The CRM vendor you choose will be a long-term partner in your business — not just a software subscription. Their stability, roadmap, support quality, and implementation ecosystem matter as much as the product itself. In 2026, the three dominant CRM platforms — Salesforce, Microsoft Dynamics 365, and HubSpot — continue to extend their capabilities at pace. Each has a strong partner ecosystem and a proven enterprise track record. But the platform alone is not enough. The quality of your implementation partner determines whether your CRM goes live on time, whether it is configured correctly for your industry, and whether your team actually adopts it. When evaluating implementation partners, look for: Autonomous AI agents are projected to handle 60% of routine CRM tasks by 2026 — but only in implementations that are properly configured and adopted. A poor implementation of a great CRM platform will underperform a well-implemented mid-tier solution every single time. Choosing the Right CRM in 2026: The Summary Step What to Do Map your processes Understand how you sell and serve before evaluating software Build a feature list Separate must-haves from nice-to-haves Audit your tech stack Ensure

5 ways to find appropriate CRM solution for your organisation Read More »

AI demand forecasting software analyzing inventory, production demand, and sales trends for food manufacturers.

Stop Wasting Inventory: The 2026 Guide to AI Demand Forecasting Software for Food Manufacturers

Every food manufacturer knows the pain. You overproduce and write off finished goods. You underproduce and disappoint your biggest customer. You order too much raw material and watch it expire on the shelf. You order too little and halt a production line. This is not a management failure. It is a forecasting failure. And in 2026, AI demand forecasting software is the tool that eliminates it. The global AI food demand forecasting market has grown to USD 1.6 billion in 2025 and is projected to reach USD 5 billion by 2033 — growing at a 34.50% CAGR. The food manufacturers driving that growth are not the largest companies in the world. They are mid-size producers who got tired of losing margin to inventory problems they could finally afford to solve. This is your guide to how AI demand forecasting works, what it delivers, and why 2026 is the year to stop running production on gut feel. Why Traditional Demand Forecasting Is Failing Food Manufacturers Most food manufacturers still forecast demand the same way they did a decade ago — historical averages, spreadsheet models, and the instinct of experienced production managers. This approach has three fatal flaws in 2026. First, it ignores external signals. Demand for food products is influenced by weather, local events, festivals, social media trends, and economic conditions — none of which a spreadsheet can process automatically or at scale. Second, it is always looking backward. Historical sales data tells you what happened. It does not tell you what is about to happen — especially in volatile markets where consumer preferences shift faster than quarterly review cycles. Third, it cannot operate at SKU level. A mid-size food manufacturer may manage hundreds of SKUs across multiple production lines, pack sizes, and customer channels. Manual forecasting at this level of granularity is simply not possible without sacrificing accuracy. The result: overproduction, waste, stockouts, and the working capital pressure that comes from carrying excess inventory. What AI Demand Forecasting Software Actually Does AI demand forecasting software replaces guesswork with machine learning models that analyse multiple data streams simultaneously — and continuously improve their predictions over time. Here is what a modern AI forecasting system processes: Historical sales data — but analysed at granular SKU, customer, and channel level, not just in aggregate. Seasonality and festival patterns — automatically identifying demand spikes tied to Diwali, Holi, Eid, wedding season, and regional festivals without manual adjustment. Weather and external signals — integrating temperature, rainfall, and local event data that influence demand for perishable food products. Production and inventory data — connecting actual stock levels, batch production records, and purchase orders to close the loop between forecast and execution. Supplier lead times — factoring procurement timelines into raw material planning so you are never caught short on critical ingredients. The result is a forecast that is not a static weekly number — it is a continuously updated, multi-variable prediction that gets more accurate every production cycle. The Business Impact: What Food Manufacturers Are Achieving The numbers from real-world AI forecasting deployments in the food industry are compelling. McKinsey research shows AI-driven demand forecasting improves service levels by up to 65% while reducing inventory costs by 20–30%. Kraft Heinz improved forecast accuracy by 8%, cut excess inventory by 25%, and reduced food waste by 10% using AI forecasting tools. Walmart’s AI-powered fresh product forecasting platform cut food waste by USD 86 million in a single year. For mid-size food manufacturers — sweet producers, namkeen manufacturers, bakeries, dairy processors, and packaged food brands — the scale is smaller but the impact is proportionally just as significant: Machine learning models have been shown to reduce forecast error rates from 35% down to 15% in food manufacturing environments — a difference that translates directly into recovered margin on every production run. Key Features to Look for in AI Demand Forecasting Software Not all demand forecasting tools are created equal. For food manufacturers specifically, here is what matters: SKU-level forecasting — the ability to forecast demand at individual product, pack size, and customer level — not just category or brand. ERP and production system integration — your forecasting tool must connect directly to your inventory, purchase orders, and production planning system to close the loop between prediction and execution. Festival and seasonality intelligence — built-in recognition of India’s complex demand calendar, including regional festivals that affect different markets at different times. Perishable goods handling — shelf-life awareness that factors expiry dates into both raw material planning and finished goods production scheduling. What-if scenario planning — the ability to model the impact of a new customer order, a raw material price spike, or a production line outage on your demand and supply position. Mobile and dashboard access — production managers and procurement teams need forecasting insights at their fingertips, not buried in a weekly report. AI Forecasting + ERP: The Combination That Closes the Loop AI demand forecasting software delivers its maximum value when it is connected to your ERP system. Standalone forecasting tools tell you what demand will look like. ERP systems manage raw material procurement, batch production, inventory, and sales. When the two work together — with AI forecasting feeding directly into ERP production planning — you get a closed-loop system that automatically adjusts purchasing, production scheduling, and inventory allocation based on the latest demand signal. This is exactly what Trident’s Microsoft Dynamics 365-based food manufacturing ERP solution enables. With AI-powered demand forecasting integrated directly into production planning, procurement, and inventory management — food manufacturers get a single platform where the forecast drives action automatically, without manual intervention. The Bottom Line for Food Manufacturers in 2026 Inventory waste is not inevitable. Stockouts are not unavoidable. Overproduction is not just “the cost of doing business.” They are the predictable results of forecasting methods that were never designed for the complexity, speed, and data volume of modern food manufacturing. AI demand forecasting software, integrated with your ERP, changes the equation permanently. The manufacturers who adopt it in 2026 will

Stop Wasting Inventory: The 2026 Guide to AI Demand Forecasting Software for Food Manufacturers Read More »

Microsoft Power Platform and Microsoft Fabric dashboard automating business workflows from real-time analytics.

Stop Building Dashboards That Nobody Acts On: Power Platform + Fabric Closes the Insight-to-Action Gap

Your organisation is not short of data. It is short of action. Dashboards get built. Reports get published. KPIs get tracked. And then — nothing changes. The same problems show up in next month’s review. The same questions get asked. The same decisions get delayed. This is the insight-to-action gap. And in 2026, it is the single biggest reason analytics investments fail to deliver business value. The good news: Microsoft Power Platform combined with Microsoft Fabric was purpose-built to close it. Why Most Dashboards Fail to Drive Action Here is an uncomfortable truth that most BI teams already know: building a beautiful dashboard is not the same as solving a business problem. The traditional analytics model works like this — data teams collect data, engineers build pipelines, analysts create reports, and dashboards get shared with decision-makers who read them, nod, and move on. The insight sits in a chart. The action never happens. In today’s landscape, organisations can no longer treat business intelligence as a standalone function. The conversation has fundamentally shifted from “What reports do we need?” to “How do we turn data into decisions — automatically, in real time?” Microsoft recognised this gap and built the answer: a unified platform where data, analytics, and automated action live together. That platform is Microsoft Fabric, powered by the Microsoft Power Platform. What Is the Insight-to-Action Gap? The insight-to-action gap is the distance between seeing something important in your data and actually doing something about it. It sounds simple to close. In practice, it rarely is. Here is why: Data lives in silos. Sales data is in one system. Finance in another. Operations in a third. By the time anyone reconciles them into a single report, the moment to act has passed. Dashboards are passive. A Power BI chart showing a revenue dip is useful. But it does not send an alert, trigger a workflow, or notify the right person automatically. It just sits there waiting for someone to notice. Action requires humans in the loop. When a metric crosses a threshold, someone needs to see it, interpret it, decide what to do, and manually execute a response. Every handoff introduces delay and the risk of inaction. This is exactly the problem that Power Platform and Microsoft Fabric solve — together. How Power Platform + Microsoft Fabric Closes the Gap Microsoft Fabric: One Platform, One Source of Truth Microsoft Fabric is Microsoft’s unified, end-to-end data and analytics platform. It brings data engineering, data warehousing, real-time analytics, data science, and Power BI together into a single experience — built on OneLake, a single data lake that spans your entire organisation. In 2026, Microsoft Fabric is the fastest growing advanced analytics certification in Microsoft history, with over 30,000 organisations now running Fabric in production. Microsoft has been positioned as a Leader in the Gartner Magic Quadrant for Analytics and BI Platforms for eighteen consecutive years — and Fabric is the platform cementing that position for the AI era. What Fabric does is eliminate the data silos that make dashboards passive. When all your data — from ERP, CRM, finance, operations, and supply chain — flows into OneLake automatically, every dashboard, every report, and every automated workflow draws from the same real-time, governed source of truth. No more reconciliation. No more stale data. No more “which number is correct?” Power Platform: Turning Insight Into Instant Action Where Fabric unifies your data, the Microsoft Power Platform turns it into action — automatically. Power Automate monitors your data in real time and triggers workflows the moment a condition is met. A sales order drops below margin threshold — an alert fires to the sales manager instantly. A supplier invoice is flagged as anomalous — an approval workflow launches automatically. Stock falls below minimum level — a purchase order is raised without human intervention. Power Apps puts the action directly into the hands of the people who need it. Instead of a dashboard that a manager reads on a laptop, a Power App surfaces the exact insight a field technician, warehouse supervisor, or store manager needs — on their phone, in the moment, with a button to act on it. Data Activator, Microsoft Fabric’s built-in trigger engine, monitors data continuously and fires alerts or Power Automate flows the moment predefined thresholds are crossed — without anyone needing to check a dashboard at all. Microsoft’s own announcement at Build 2026 called this the next frontier: translytical task flows that blend transactional and analytical systems, allowing users to act on insights directly from dashboards and streamlining decision-to-action cycles. The gap between seeing and doing is closing — and closing fast. What This Looks Like in Practice Retail: Power BI flags a stock anomaly in a specific store. Data Activator triggers a Power Automate flow that notifies the regional manager and raises a transfer order — all before the store opens. Finance: Fabric detects a budget variance above 10%. Power Automate routes it for approval, notifies the CFO, and logs the exception — without anyone running a report. Manufacturing: A production yield drops below target mid-shift. A Power App on the floor supervisor’s phone shows the deviation with a one-tap escalation button — no email chain, no delay. Logistics: A delivery SLA is at risk based on real-time tracking data. An automated alert fires to the account manager and a contingency workflow launches — while the shipment is still in transit. The 2026 Shift: From Reporting to Acting Microsoft Fabric IQ, now generally available, represents the next step — natural language data exploration where business users ask questions in plain English and get instant answers from their data, without writing a query or opening a dashboard. Combined with Copilot in Power BI, which can now generate DAX calculations, summarise reports, and build visuals through natural language — the barrier between data and decision has never been lower. Organisations that adopt Power Platform and Fabric together are not just getting better dashboards. They are building intelligence infrastructure — where every

Stop Building Dashboards That Nobody Acts On: Power Platform + Fabric Closes the Insight-to-Action Gap Read More »

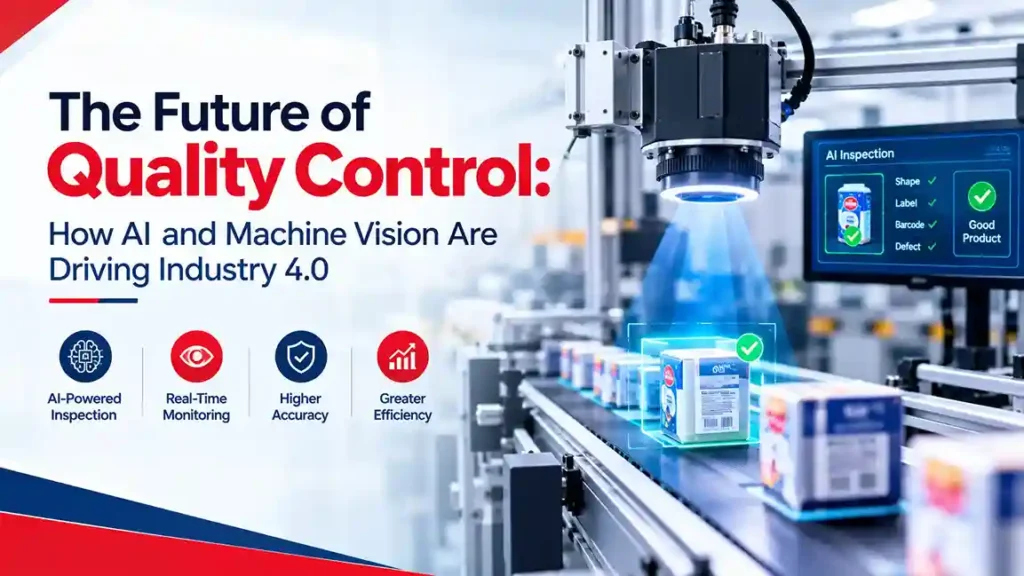
Machine vision system inspecting products on a manufacturing line to detect defects using AI.

7 Manufacturing Defects Machine Vision Systems Catch Before Customers Do

Machine Vision Systems for Manufacturing Defects: What They Actually Catch A human inspector on a bottling line can reliably spot maybe 80% of visible defects — and that number drops fast after four hours on shift, per repeated studies on visual inspection fatigue. A camera running at 200 frames per second doesn’t get tired, doesn’t blink, and doesn’t miss the third defective cap in a row because attention lapsed. That gap between human and machine inspection accuracy is why manufacturers across automotive, pharma, and packaging are shifting quality control to vision systems — not to replace inspectors, but to catch what they structurally can’t. Here are seven defect categories where machine vision consistently outperforms manual checks, and why that matters for your production line. 1. Surface Scratches and Micro-Cracks High-resolution cameras paired with structured lighting detect surface anomalies as small as 10-20 microns — invisible to the naked eye under standard factory lighting. In metal stamping and glass manufacturing, this catches stress micro-cracks before they propagate into field failures, which is exactly the kind of defect that triggers costly warranty claims months after shipment. 2. Dimensional and Tolerance Deviations Calipers and gauges check dimensions in batches; vision systems check every unit, in real time, against CAD tolerances. A part 0.3mm out of spec on a bearing assembly won’t fail obviously on a manual check, but a vision system flags it instantly and routes it off the line before it reaches assembly, where the cost of catching the same defect is typically 10x higher. 3. Color and Finish Inconsistency In food packaging and consumer goods, color deviation often signals a deeper process issue — wrong batch mix, temperature drift, or expired coating material. Vision systems using colorimetric analysis catch shade variance beyond human perceptual threshold, which matters directly for brand consistency on retail shelves where a mismatched label color gets a product rejected at the distributor level. 4. Missing or Misaligned Components Assembly lines producing electronics or automotive sub-assemblies lose components constantly — a missing screw, an unseated connector, a skipped weld point. Vision systems trained on reference images flag incomplete assemblies at the exact station where the omission occurred, not three stations later when the unit is harder to rework. 5. Label and Print Defects Barcode smudging, incorrect batch codes, or misaligned printing on pharma and FMCG packaging isn’t just a cosmetic issue — it’s a compliance risk. OCR-enabled vision systems verify printed text, barcodes, and expiry dates against the production order in real time, which is critical for industries where a mislabeled batch triggers a regulatory recall, not just a customer complaint. 6. Contamination and Foreign Material In food manufacturing and pharma, foreign particle detection is one of the hardest things to do reliably by eye — a fragment of packaging film in a sealed product is easy to miss on a fast-moving line. Near-infrared and hyperspectral vision systems detect foreign material invisible to standard RGB cameras, directly reducing the contamination-driven recalls that are among the costliest events a food manufacturer can face. 7. Weld and Seal Integrity Poor welds or incomplete seals often look fine externally but fail under stress or in transit. Vision systems combined with thermal imaging assess weld penetration and seal continuity without destructive testing, catching structural defects that a purely visual pass would miss entirely. Why This Matters Beyond the Inspection Station Catching a defect on the line is only half the value. The real ROI shows up when defect data feeds directly into your ERP’s quality management module — linking a specific defect back to the machine, shift, operator, and raw material batch that produced it. That traceability is what turns a one-off catch into a root-cause fix, and it’s the difference between a vision system that flags problems and one that actually reduces your defect rate over time. For manufacturers running Dynamics 365 Finance & Operations, integrating machine vision output with the quality management module means non-conformances, supplier scorecards, and corrective action workflows update automatically — no manual data re-entry between the shop floor and the quality team. Considering machine vision for your production line? Talk to Trident’s manufacturing team about integrating vision-based quality inspection with your Dynamics 365 F&O quality management workflows. FAQ Q: What defects can machine vision systems detect that humans miss?A: Surface micro-cracks, dimensional deviations under a millimeter, color inconsistency beyond human perception, and foreign contaminants invisible to standard lighting. Q: How does machine vision integrate with ERP quality management?A: Defect data feeds directly into modules like Dynamics 365 F&O quality management, linking each defect to the machine, operator, and batch for root-cause traceability. Q: Is machine vision worth it for small and mid-size manufacturers?A: Yes — the cost of catching a defect on the line is typically far lower than catching it after assembly or shipment, making ROI achievable even at moderate production volumes.

7 Manufacturing Defects Machine Vision Systems Catch Before Customers Do Read More »

Power BI pharmacy dashboard displaying profit margins, dead stock, expiry losses, top loss-making drugs, and branch performance.

Power BI Pharmacy Dashboards: See Your Top 10 Money-Losing Drugs in Real-Time

Every pharmacy has drugs that are silently draining profit. The problem is most owners don’t know which ones — until it’s too late. A medicine sitting on the shelf past its expiry date. A high-cost drug with razor-thin margins being sold without discount controls. A slow-moving SKU tying up valuable shelf space and working capital month after month. These are not exceptional situations. They happen every day in pharmacies that are running without real-time data visibility. Power BI pharmacy dashboards change that completely. They give pharmacy owners, chain managers, and finance teams a live, visual window into exactly which drugs are costing you money — and why. The Problem With How Most Pharmacies Track Drug Performance Most pharmacies still rely on monthly reports, weekly stock counts, and end-of-day billing summaries to understand their business performance. By the time the data reaches a decision-maker, it is days or weeks old. The slow-moving stock has already aged further. The margin-eroding drug has already been sold at a loss hundreds of times. The pharmaceutical industry is seeing an enormous shift toward real-time analytics. 69% of commercial pharmacy teams are actively increasing their spending on data analytics solutions, and more than 85% of pharma executives plan to increase investment in data and digital tools through 2026. The reason is simple: pharmacies that see their data in real time make better decisions, faster. Power BI is the tool making this possible for pharmacies of every size. What Is a Power BI Pharmacy Dashboard? Microsoft Power BI is a business intelligence platform that connects to your pharmacy management system, ERP, or billing software and transforms raw transaction data into live, interactive visual dashboards. For pharmacies specifically, a Power BI dashboard pulls data from your point-of-sale system, inventory records, purchase orders, and financial reports — and presents it in a single screen that updates automatically, in real time. No manual reports. No spreadsheet exports. No waiting until month-end to find out where your money went. Seeing Your Top 10 Money-Losing Drugs in Real Time This is where Power BI delivers its most immediate and powerful value for pharmacy owners. A well-built Power BI pharmacy dashboard can show you — right now, today — a ranked list of your top 10 money-losing drugs based on multiple profitability factors: Margin loss — drugs being sold below or too close to cost price due to pricing errors, discount overrides, or supplier price changes not reflected in your selling price. Dead stock value — medicines that have not moved in 30, 60, or 90 days, with the total capital value tied up in each. A visual ranking of these by rupee value makes the cost of inaction immediately visible. Expiry loss forecast — drugs whose current stock will expire before projected consumption. The dashboard flags these before the loss occurs — not after. High-return rate drugs — medicines being returned at higher-than-average rates, signalling quality, storage, or dispensing issues that are quietly eroding revenue. Purchase price vs selling price variance — automatic alerts when your supplier raises a drug’s cost price but your selling price hasn’t been updated, creating an invisible margin gap on every sale. One pharma analytics implementation reported a 40% reduction in reporting cycle time and a significant improvement in revenue tracking accuracy after deploying Power BI dashboards. For a pharmacy chain, that kind of visibility translates directly into faster decisions and recovered margin. Key Metrics Your Power BI Pharmacy Dashboard Should Track Beyond the top 10 money-losing drugs, a comprehensive Power BI pharmacy dashboard gives you live visibility across: Sales Performance Inventory Intelligence Margin and Profitability Supplier and Purchase Analytics Branch and Multi-Location Performance Why Power BI Works So Well for Pharmacy Analytics The reason Power BI has become the go-to analytics platform for pharmacies — particularly those running on Microsoft Dynamics 365 or similar ERP systems — comes down to three things. Seamless integration. Power BI connects directly to your pharmacy management system, ERP, billing software, SQL databases, and even Excel files — with no manual data export required. Data flows in automatically and dashboards update in real time. No IT team required. As of 2026, Power BI’s Copilot feature allows pharmacy managers to query their own data using natural language — asking questions like “which drugs had the lowest margin last month” and getting an instant visual answer without writing a single formula. Affordable at every scale. Power BI starts at approximately $14 per user per month — making enterprise-grade pharmacy analytics accessible to independent pharmacies, not just large chains. The Competitive Advantage of Real-Time Pharmacy Analytics Pharmacies operating with real-time Power BI dashboards are making decisions that their competitors simply cannot make — because their competitors don’t have the data. They catch margin erosion before it compounds. They clear dead stock before it expires. They identify their money-losing drugs in real time and take corrective action within hours — not weeks. In an industry where margins are already thin and competition is intense, that visibility is not a luxury. It is the difference between a profitable pharmacy and one that is slowly losing money without knowing why. Power BI doesn’t just show you your top 10 money-losing drugs. It gives you the power to stop losing money on them — starting today. Trident Information Systems integrates Microsoft Power BI with Dynamics 365-based pharmacy management solutions, giving pharmacy chains real-time profitability dashboards configured for your specific business. Talk to our experts at tridentinfo.com/contact.

Power BI Pharmacy Dashboards: See Your Top 10 Money-Losing Drugs in Real-Time Read More »

Smart ERP system managing recipe formulation, inventory, expiry tracking, and production for sweet manufacturers.

How Sweet Manufacturers Reduced Waste by 35% Using Smart ERP Systems

Waste is the silent profit killer in every sweet manufacturing business. For sweet manufacturers in India, the Middle East, and beyond, implementing robust ERP systems for sweet manufacturing has become the single most effective strategy to reduce raw material spoilage, prevent overproduction, and recover margins that were previously lost to inefficiency. The good news? Sweet manufacturers who have implemented smart ERP systems are consistently reporting waste reductions of 30–35% within the first year. Here is exactly how they are doing it — and what it means for your business. The Real Cost of Waste in Sweet Manufacturing Food waste is not just an operational inconvenience. It is a direct hit to your bottom line. 20–30% of the world’s food is wasted every year — and confectionery and sweet production is no exception. For sweet manufacturers specifically, waste occurs at multiple points: raw material spoilage, overproduction, inaccurate recipe scaling, expired finished goods, and poor demand forecasting. Each of these failure points is preventable — with the right system in place. The food manufacturing software market is growing from USD 5.82 billion in 2025 to USD 6.34 billion in 2026, driven largely by manufacturers who can no longer afford the cost of running without intelligent production management. Around 54% of food manufacturers are now actively investing in tools specifically to reduce waste and track production efficiency. How Smart ERP Systems Eliminate Waste at Every Stage 1. Recipe Management That Enforces Precision Every Time The single biggest source of waste in sweet manufacturing is inconsistent recipe execution. When production staff measure ingredients manually — or rely on memory and handwritten notes — variations creep in with every batch. Too much mawa in one run. Too little sugar in the next. These deviations don’t just affect quality — they directly increase raw material consumption beyond what the recipe requires. Smart ERP systems store standardized digital recipes with exact ingredient quantities for every product. When a production order is raised, the system automatically calculates precise material requirements and issues them to the floor — eliminating guesswork, reducing over-usage, and ensuring every batch is consistent. Operations with real-time recipe tracking consistently identify 2–6% improvement opportunities in ingredient yield within the first six months alone. On a mid-scale sweet manufacturing operation, recovering even 3% in yield translates directly into lakhs of rupees in recovered margin every year. 2. Demand Forecasting That Prevents Overproduction Festival season demand for sweets can spike dramatically — Diwali, Holi, Eid, and wedding season all create production surges that are notoriously difficult to plan for manually. Without data-driven forecasting, most sweet manufacturers overproduce to avoid stockouts — then write off unsold finished goods as waste. Or they underproduce, miss the demand window, and lose revenue. Neither outcome is acceptable. ERP systems use historical sales data, seasonal patterns, and live order information to generate accurate production forecasts. Production is planned to match real demand — not estimates. The result is a dramatic reduction in finished goods waste and a significant improvement in working capital efficiency. Accurate demand forecasting through ERP reduces safety stock requirements by 15–30% — freeing up capital that was previously tied up in excess inventory. 3. Raw Material Expiry and FIFO Management Perishable raw materials are the backbone of sweet manufacturing — and they are also the biggest source of silent waste. Ghee, mawa, milk solids, dry fruits, and flavouring agents all have limited shelf lives. Without a system tracking expiry dates at batch level, older stock gets buried behind newer deliveries and expires before use. Smart ERP systems enforce FIFO (First In First Out) rules automatically. Every raw material batch is tracked from the moment it enters your store — with expiry alerts triggered well before the critical date. Slow-moving materials near expiry are flagged for prioritized use or returned to the supplier — turning potential write-offs into managed outcomes. 4. Production Waste Identification and Root Cause Analysis ERP systems do something manual processes simply cannot: they capture actual vs. expected yield data for every production run. When actual output falls below standard yield, the system flags the variance immediately. Was it equipment inefficiency? Incorrect ingredient proportions? A process deviation on the floor? ERP gives production managers the data to identify the exact cause — and fix it before the next batch. This closed feedback loop is what drives the 30–35% waste reduction that smart manufacturers are achieving. It is not a one-time improvement — it compounds over time as production processes get tighter with every data cycle. 5. Real-Time Inventory Visibility Across Raw Materials and Finished Goods One of the most common — and costly — forms of waste in sweet manufacturing is purchasing raw materials that are already in stock because nobody had an accurate inventory count. Smart ERP systems provide real-time inventory visibility across every raw material, packaging component, and finished product. Purchase orders are triggered automatically only when stock genuinely falls below minimum levels. Purchasing decisions are data-driven, not reactive. Around 52% of mid-sized food manufacturers now use smart inventory tracking specifically to reduce losses — and the results speak for themselves. The Competitive Advantage of Going Smart Sweet manufacturers who have implemented ERP are not just reducing waste. They are building a structural cost advantage over competitors still running on spreadsheets and manual processes. Lower waste means lower cost of production. Lower cost of production means better pricing power. Better pricing power means stronger margins and the ability to grow — whether that is expanding into modern trade, launching new SKUs, or scaling production capacity. The 35% waste reduction is not a promise. It is a result that smart ERP deliver — consistently, measurably, and permanently. Trident Information Systems offers a Microsoft Dynamics 365-based food manufacturing ERP solution specifically configured for sweet and namkeen producers. Talk to our experts at tridentinfo.com/contact.

How Sweet Manufacturers Reduced Waste by 35% Using Smart ERP Systems Read More »

dynamics-365-business-central-partner-in-uae

Best Dynamics 365 Business Central Partner in the UAE

Quick Answer Trident Information Systems is a Microsoft Gold-certified Dynamics 365 partner in the UAE, delivering Dynamics 365 Business Central and Dynamics 365 Finance & Operations (F&O) implementation, support, and resource augmentation services. With more than 25 years of ERP experience, 250+ completed engagements, and 170+ dedicated technical and functional resources, Trident serves businesses across Dubai, Abu Dhabi, and the wider UAE in retail, manufacturing, distribution, and hospitality. Key Takeaways What Is a Dynamics 365 Business Central Partner in the UAE? A Dynamics 365 Business Central partner in the UAE is a Microsoft-certified consulting firm authorized to sell, implement, customize, and support Business Central — Microsoft’s cloud ERP for small and mid-sized businesses. These partners handle everything from initial licensing and system configuration to data migration, staff training, and ongoing support, acting as the primary point of contact between a UAE business and Microsoft’s ERP ecosystem. Trident Information Systems holds this certification and positions itself as one of the region’s established Business Central implementation partners in India, UAE, and Africa, with particular strength in helping companies migrate from legacy Dynamics NAV to the modern, cloud-based Business Central platform. Why This Matters for UAE Businesses UAE companies moving off spreadsheets, QuickBooks, or aging on-premise ERP systems need a partner who understands both the Microsoft platform and local regulatory requirements — VAT filing, Corporate Tax reporting, and Arabic/English bilingual operations. A certified local partner reduces implementation risk and shortens time-to-value compared to working with an offshore team unfamiliar with UAE compliance. This footprint lets Trident offer UAE clients a blend of local responsiveness (regional consultants who understand VAT and corporate tax) and global delivery capacity (a large offshore resource bench for cost-efficient implementation and support). D365 F&O Implementation Partner in the UAE For larger, more complex organizations — typically those with multi-entity finance, advanced manufacturing, or global supply chains — Trident operates as a D365 F&O implementation partner in the UAE, delivering Dynamics 365 Finance & Supply Chain Management (formerly Dynamics AX). What the Implementation Covers Trident’s F&O implementation engagements typically span: Trident also positions F&O migration as a natural next step for companies outgrowing Dynamics AX, framing the move as an upgrade path toward improved supply chain visibility and finance management rather than a disruptive rebuild. Industries Served Trident’s F&O implementation work in the UAE concentrates on manufacturing, retail, food & beverage, distribution, and supply chain-heavy businesses, sectors where F&O’s advanced production and logistics tooling delivers the clearest ROI. D365 F&O Support Partner in the UAE Once a system is live, ongoing reliability matters as much as the initial rollout. As a D365 F&O support partner in the UAE, Trident offers both dedicated and shared support models so businesses can choose the coverage level that matches their budget and risk tolerance. Support services include: A dedicated support model assigns a fixed team to one client’s environment, while a shared support model pools consultants across multiple clients—a more economical option for smaller F&O deployments that don’t need full-time coverage. D365 F&O Resources in UAE: Staff & Resource Augmentation Many UAE businesses need extra hands for a specific project phase — a data migration sprint, a module rollout, or coverage during a permanent hire’s notice period — without the overhead of a full-time contract. This is where Trident’s D365 F&O resources in UAE offering fits. Trident maintains a bench of 170+ technical and functional resources covering Business Central, F&O, and LS Retail, available on: Because staff augmentation removes the overhead of local hiring, payroll, and infrastructure, it typically lowers total resourcing costs while still giving UAE businesses access to Microsoft-certified F&O and Business Central specialists. Why UAE Businesses Choose Trident Information Systems Frequently Asked Questions Q1. Is Trident Information Systems a Microsoft-certified partner in the UAE? Ans: Yes. Trident holds Microsoft Gold Partner status for Dynamics 365 Business Central and Finance & Operations and is also an LS Retail Diamond Partner, with active delivery teams covering the UAE. Q2. Can Trident migrate our company from Dynamics NAV or AX to Dynamics 365? Ans: Yes. Migration from Dynamics NAV to Business Central and from Dynamics AX to F&O is one of Trident’s core service lines, including data migration, reconfiguration, and user retraining. Q3. Does Trident offer ongoing support after go-live, not just implementation? Ans: Yes. Trident provides both dedicated and shared 24/7 support models for live Business Central and F&O environments, covering issue resolution, upgrades, and performance monitoring. Q4. Can we hire Dynamics 365 resources from Trident without a full implementation project? Ans: Yes. Trident offers standalone staff and resource augmentation, drawing from a bench of 170+ certified Business Central, F&O, and LS Retail specialists for onshore or offshore placement. Q5. Does Dynamics 365 support UAE VAT and corporate tax requirements? Ans: Yes. Dynamics 365 Business Central and F&O can both be configured for UAE VAT filing and corporate tax reporting, and Trident’s implementation scope typically includes this localization. Q6. What industries does Trident primarily serve in the UAE? Ans: Retail, hospitality, manufacturing, food & beverage, distribution, transportation, logistics, and oil & gas are Trident’s primary industry verticals in the region.

Best Dynamics 365 Business Central Partner in the UAE Read More »